Ever stared at a live currency chart and felt a mix of curiosity and overwhelm? You’re not alone.
That moment is the spark behind every solid forex trading guide – it tells you there’s something worth learning, even if the jargon feels like a foreign language.
But before you dive into indicators or risk formulas, it helps to pause and ask: what do you actually want to achieve with your trading?
Maybe you’re an aspiring trader looking to grasp the fundamentals before risking real money, or an experienced player hunting consistency after a few rough patches.
In our experience at FX Doctor, the first step that separates hopeful beginners from those who actually stick around is building a solid mental model of how the forex market moves.
Think about it this way: the market is a massive, 24‑hour auction where banks, corporations, and individual traders constantly buy and sell currencies based on supply‑demand dynamics.
When you understand that each price swing reflects a collective decision, the charts start to feel less like a mystery and more like a conversation you can join.
And that conversation begins with the basics: what currency pairs are, how the major sessions overlap, and which order types let you control entry and exit.
You’ll quickly see why a structured forex trading guide matters – it keeps you from hopping from one flashy strategy to another without a foundation.
So, what should you focus on first? Start with the market’s anatomy: the bid‑ask spread, pips, and the concept of leverage – all the building blocks that shape every trade.
Next, get comfortable with a simple demo account. It’s free, it mirrors real‑time price action, and it lets you experiment without risking capital.
And remember, patience is a skill you can train. Treat each trade like a mini‑experiment: note why you entered, what the market did, and what you learned.
By the time you’ve logged a handful of demo trades, you’ll have a clearer picture of your strengths, your emotional triggers, and the types of setups that feel natural to you.
That’s the foundation we’ll build on in the rest of this forex trading guide – a step‑by‑step path from curiosity to competence.
TL;DR
This forex trading guide walks you from the first spark of curiosity through building a solid market foundation, demystifying currency pairs, spreads, and demo trading so you can trade with confidence. By the end you’ll have a clear roadmap, practical checkpoints, and the mindset to turn every trade into a learning experiment, setting the stage for consistent improvement.
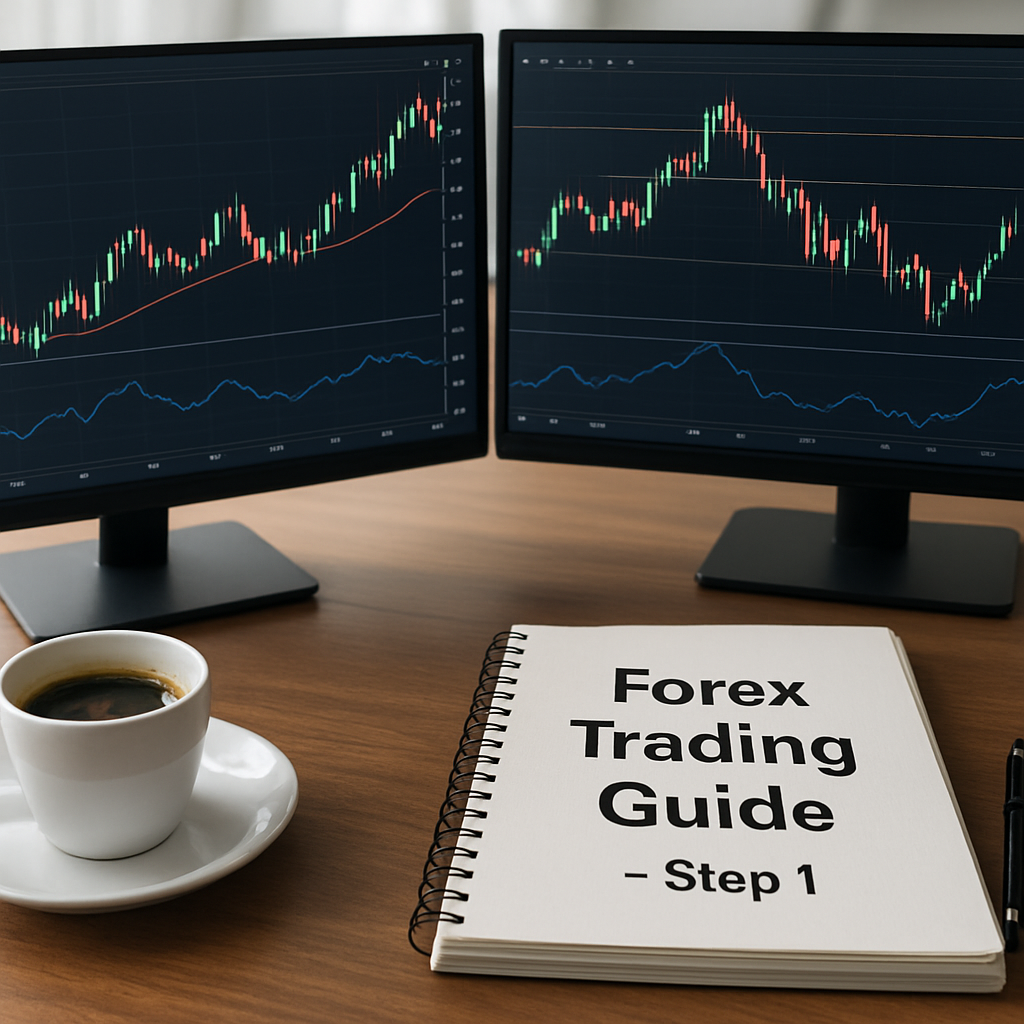
Step 1: What Is Forex Trading and How the Market Works
Picture this: you open a chart, the numbers are moving, and you wonder what exactly you’re looking at. It feels like you’ve walked into a room where everyone’s speaking a different language. That moment of confusion is the perfect starting point for our forex trading guide. Let’s break it down together, step by step.
Forex, short for foreign exchange, is simply the market where currencies are bought and sold. Think of it as a massive, 24‑hour marketplace where banks, corporations, and individual traders trade the value of one currency against another. When you hear “EUR/USD is at 1.10,” that means one euro buys 1.10 US dollars. The price moves because traders collectively decide the euro is stronger or weaker than the dollar at that instant.
Why does the market never close? Major financial centres – London, New York, Tokyo, Sydney – each hand off the trading baton as their business day ends. This overlap creates continuous liquidity, which is why you can place a trade at 3 a.m. in New York and still get a decent fill.
Key components you need to know
- Currency pair: The base currency (first) and the quote currency (second). You’re always buying one while selling the other.
- Bid‑ask spread: The difference between the price buyers are willing to pay (bid) and the price sellers want (ask). It’s the broker’s built‑in cost.
- Pip: The smallest price move a currency pair can make, usually 0.0001 for most pairs.
- Leverage: A tool that lets you control a larger position with a smaller amount of capital. It magnifies both gains and losses, so use it wisely.
Imagine you’re a beginner trader who just signed up for a demo account. You’ll see these terms pop up instantly. If you’re wondering where to learn them in depth, our FX Doctor courses walk you through each concept with real‑world examples and video lessons.
Now, let’s talk about how a trade actually happens. You decide to go long (buy) EUR/USD because you think the euro will strengthen. You place a market order, the broker matches you with a counter‑party, and your position opens at the current ask price. If the price rises to 1.12, you could close (sell) the pair at the bid price, pocketing the difference – minus the spread and any fees.
But what about risk? That’s where the market’s mechanics become your safety net. By setting a stop‑loss order, you tell the platform to automatically exit the trade if the price moves against you by a predefined amount. It’s a simple way to protect your capital while you’re still learning the ropes.
Why regulation matters
Forex trading isn’t a lawless frontier. Different jurisdictions impose rules that affect how brokers operate and what protections you receive. If you ever need legal clarification, especially around crypto‑related forex pairs, NeosLegal UAE Crypto Lawyers provide specialized advice.
And if you’re building an online presence for your trading insights, you might wonder how to get discovered. Platforms like Rebelgrowth help traders and educators boost their SEO footprint, ensuring the right audience finds your content.
Tracking your performance is another piece of the puzzle. A simple analytics tool such as Trackerly lets you monitor win rates, average pips per trade, and risk‑reward ratios without drowning in spreadsheets.
Here’s a quick checklist to make sure you’ve covered the basics before you move on:
- Identify the currency pair you’ll trade.
- Understand the bid‑ask spread and how it affects your entry price.
- Know what a pip represents for your chosen pair.
- Decide on an appropriate leverage level for your risk tolerance.
- Set a stop‑loss order on every trade.
When you can name each of these items without hesitation, you’ve built the mental model that turns a chaotic chart into a conversation you can actually join.
Below is a short video that visualises the market’s 24‑hour cycle, showing how the major sessions overlap and why liquidity spikes at certain times.
Take a moment to watch, then come back and note which session you feel most comfortable trading in. Do you prefer the calm of the Asian session or the volatility of the London‑New York overlap? Your preference will shape the rest of your journey.

Step 2: Key Forex Instruments, Sessions, and Order Types
Alright, you’ve got a demo account humming and you know how a pip works. The next logical step is to recognise what you’re actually trading, when the market is awake, and how you’ll tell your platform what to do. This is the meat of any solid forex trading guide.
Major currency pairs you’ll see most
When you open a chart you’ll quickly notice a handful of symbols dominate the price‑action feed – EUR/USD, USD/JPY, GBP/USD, USD/CHF, AUD/USD, USD/CAD and NZD/USD. These are the so‑called “majors” because they involve the world’s biggest economies and therefore boast the deepest liquidity and tightest spreads. If you want a smoother experience on a demo platform, start with one of these pairs; the tighter the spread, the less you’ll pay in slippage during a rapid move.
For a quick reference, the IG guide breaks down each major pair, its typical nick‑names and the economic drivers that move it major currency pairs overview. A handy tip: keep an eye on the commodity‑linked pairs – AUD/USD reacts to iron‑ore and copper prices, while USD/CAD is highly sensitive to oil.
Understanding the 24‑hour trading sessions
The forex market never really sleeps. It’s split into three overlapping sessions – the Asian (Tokyo), European (London) and North American (New York) sessions. In practice you’ll feel the most activity when the London and New York sessions overlap, roughly between 13:00 – 17:00 GMT. That’s when the bulk of the daily volume flows, and you’ll see tighter spreads and more predictable price swings.
For aspiring traders, a simple trick is to mark the session windows on your chart’s time‑axis. Notice how EUR/USD often makes its biggest moves during the London‑New York overlap, while USD/JPY tends to be more active in the Asian session. Knowing when the market is “wide awake” helps you decide whether you want to trade fast‑breakout setups or slower, trend‑following moves.
Order types you need to master
If you’ve ever wondered how to get into a trade without staring at the screen all day, the answer lies in the right order type. The basics – market, limit, stop entry, stop loss and trailing stop – cover 95 % of what you’ll ever need. Babypips offers a clear rundown of these basic forex order types, and the terminology is worth committing to memory.
Here’s a quick cheat‑sheet you can paste into a notebook:
- Market order: buy or sell at the best available price right now. Use it when you need instant execution.
- Limit order: set a price you’re happy to pay (for a buy) or receive (for a sell). The trade only fires when the market reaches that level.
- Stop entry order: the opposite of a limit – you buy above the market or sell below it, usually to catch a breakout.
- Stop‑loss order: protects you from a bigger loss than you’re comfortable with. It’s a safety net that automatically closes the position once the price hits a predefined threshold.
- Trailing stop: a dynamic stop‑loss that moves in your favour as the market goes your way, locking in profit while still giving the trade room to breathe.
Advanced traders sometimes layer these together with OCO (one‑cancels‑the‑other) or OTO (one‑triggers‑the‑other) combos, but for now stick to the basics. Remember, a poorly placed stop can bite you harder than a market‑order slippage.
Want to see these concepts in action? The short video below walks through a live chart, placing a limit entry, a stop‑loss and a trailing stop on the same trade. Watch how the orders behave when the price swings.
Notice how the market order fills instantly, while the limit sits patiently until the price dips. The stop‑loss guards the downside, and the trailing stop starts moving once the trade is in profit. That visual cue alone can turn a vague idea into a concrete routine.
Actionable checklist for today:
- Pick one major pair (e.g., EUR/USD) and note its typical spread during the London‑New York overlap.
- Mark the three session windows on your chart’s time‑axis.
- Place a demo market order, then cancel it and replace it with a limit order 10 pips away from the current price.
- Add a stop‑loss 20 pips below your entry and a trailing stop of 15 pips.
- Observe how each order reacts over the next 2‑3 hours and jot down any surprises.
By the end of this exercise you’ll have a clear mental map of what you can trade, when the market is most active, and which order types give you control. That’s the foundation you need before you start layering indicators or complex strategies.
Step 3: Fundamental Technical Analysis Concepts for Beginners
Ever felt like the chart is speaking a secret language? You’re not alone. The first step is to learn the most common words – price structure, trends, support and resistance, and a handful of candlestick patterns.
1. Read the price structure
Every move on a forex chart can be broken down into three parts: a swing high, a swing low, and the direction that follows. When the market makes a higher high and a higher low, you’re looking at an up‑trend. The opposite tells you a down‑trend is forming. If the highs and lows are roughly equal, the market is ranging.
Think about a morning commute. If traffic keeps getting slower, you know you’re heading into a jam. In the same way, higher highs and higher lows signal that buying pressure is building.
2. Draw simple trend lines
Grab your charting tool and connect at least two swing points. A line that runs along the lows of an up‑trend is called a “support” line; a line that follows the highs of a down‑trend is “resistance.” The magic happens when price respects those lines – it will often bounce off them before moving on.
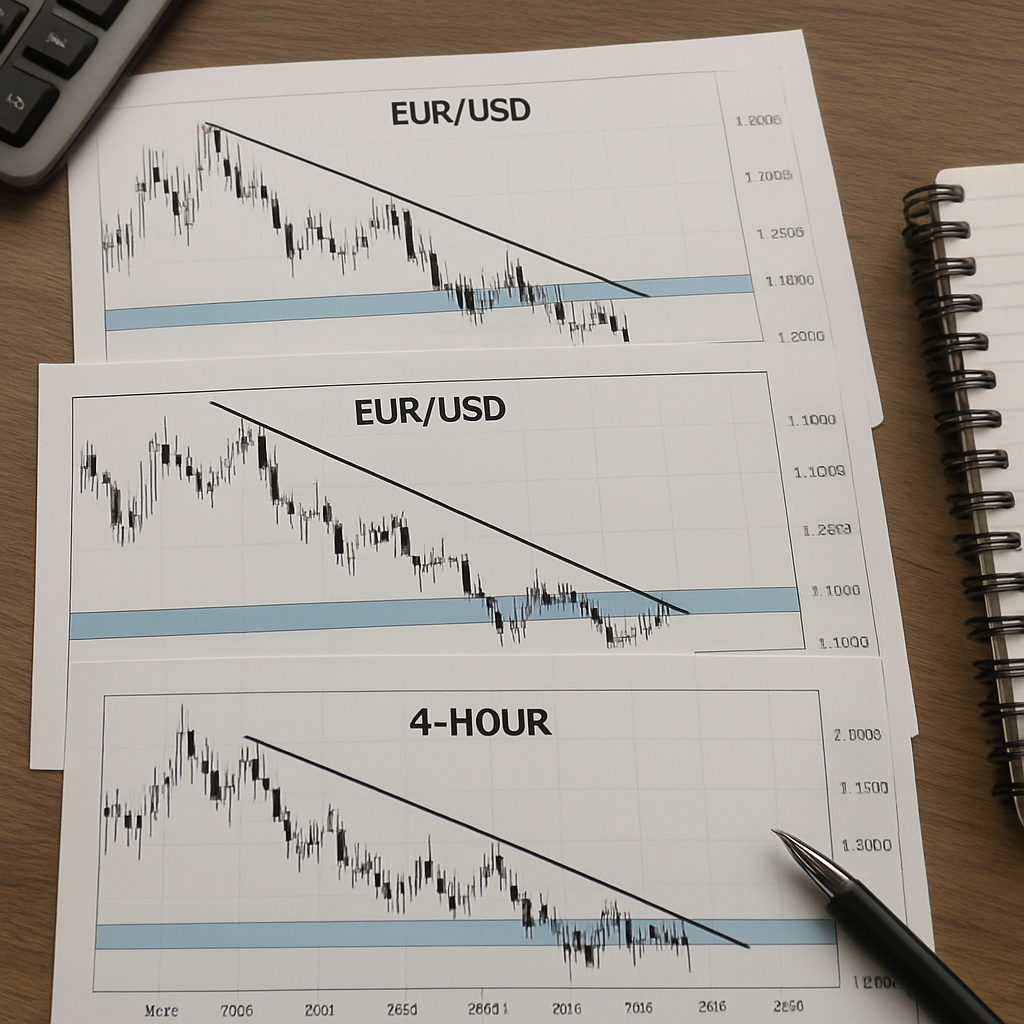
Real‑world example: On a EUR/USD daily chart last March, the price repeatedly bounced off a support line at 1.0800 before breaking higher. If you had placed a buy order a few pips above that line, you could have joined the move with a clear stop‑loss just below the line.
3. Identify support and resistance zones
Support and resistance aren’t always precise lines; they’re zones where price has lingered before. Mark the area with a rectangle rather than a single line – this gives the market room to breathe.
Pro tip: Look back 20‑30 candles to see where the price turned before. The more times a zone has been tested, the stronger it becomes. Beginners often set their stop‑loss right outside the zone and their profit target near the next opposing zone.
4. Get comfortable with basic candlesticks
A candlestick shows four pieces of information: open, close, high and low for a given period. A “bullish engulfing” candle – where the body completely covers the previous bearish body – often signals a short‑term reversal.
Picture this: You’re watching a GBP/USD 1‑hour chart and a bullish engulfing appears after a dip to a support zone. Many traders take that as a cue to go long, placing a stop‑loss just below the low of the engulfing candle.
5. Add a moving average for extra context
The 20‑period simple moving average (SMA) is a popular, low‑maintenance tool. When price sits above the SMA, the bias is generally bullish; below it, bearish. If the SMA itself turns upward, that adds confidence to an up‑trend.
Example: On a USD/JPY 4‑hour chart, the price crossed above the 20‑SMA and stayed there for three consecutive candles. A beginner could have entered a long position with a stop‑loss a few pips under the SMA.
Actionable checklist for today
- Open a demo chart for any major pair (EUR/USD works well).
- Identify the most recent swing high and swing low, then label the trend direction.
- Draw a trend line along the lows (if up‑trend) or highs (if down‑trend).
- Mark at least two support and two resistance zones using rectangles.
- Spot one candlestick pattern – try a bullish or bearish engulfing – and note its position relative to your zones.
- Overlay a 20‑period SMA and see whether price is above or below it.
- Place a mock entry a few pips above a support zone that also aligns with a bullish engulfing and SMA bias.
- Set a stop‑loss just below the support zone, then record the trade outcome after 4‑6 candles.
When you finish, compare the trade’s result with your notes. Did the price respect the zones? Did the candlestick give an early warning? Those tiny experiments build the intuition that turns a chart from a puzzle into a conversation.
Remember, technical analysis is a toolbox, not a crystal ball. The more you practice these fundamental concepts, the easier it becomes to spot high‑probability setups without drowning in complex indicators.
Step 4: Core Risk Management Practices for Forex Traders
Alright, you’ve got your swing highs, your support zones, and a candlestick that looks like a green flag. The next big question is: how much of your account are you willing to lose on any single trade? If you can answer that, you’ve already taken the hardest part of trading out of the equation.
Why risk management beats a perfect entry
Think about it like this – you wouldn’t drive a sports car without a seatbelt, right? In trading the seatbelt is your risk‑management plan. Even the best‑looking setup can get whacked by a surprise news spike, and without a safety net you’ll see your balance shrink fast.
When I first started, I chased “perfect” entries and ignored how big my positions were. One nasty swing wiped out 40 % of my demo balance before I even realized I’d over‑leveraged. That lesson taught me that protecting the downside is more important than hunting the upside.
Step‑by‑step risk‑management checklist
1. Set a %‑risk rule. Most seasoned traders risk 1‑2 % of their account per trade. If you have $5,000, that means a $50‑$100 risk window.
2. Calculate position size. Take your risk amount, divide it by the distance to your stop‑loss in pips, then multiply by the pip value. A handy position sizing calculator can do the math in seconds.
3. Choose a sensible reward‑to‑risk ratio. Aim for at least 2:1 or 3:1. That way, even if you win only half your trades, you’ll still come out ahead. Babypips breaks down the math nicely in their reward‑to‑risk guide.
4. Adjust for volatility. On a choppy day, widen your stop or shrink your lot size. On calm days, you can tighten the stop a bit and keep the same risk amount.
5. Lock in profits with a trailing stop. Once the price moves in your favour, a trailing stop lets you protect gains without having to guess a fixed target.
Common pitfalls (and how to avoid them)
‑ Risking a fixed dollar amount. That works until your account grows – suddenly $100 is only 0.2 % of a $50,000 balance, and you’re under‑exposing yourself.
‑ Setting stops too tight. If your stop is only a few pips away, the spread alone can trigger it. Always factor in the broker’s typical spread for the pair you trade.
‑ Ignoring the trade‑size minimum. Some brokers won’t let you trade fractions of a lot smaller than 0.01. Round your calculated size to the nearest allowed increment.
Quick reference table
| Risk Element | Typical Choice | Why it matters |
|---|---|---|
| Risk per trade | 1‑2 % of account | Balances growth and protection |
| Reward‑to‑risk ratio | ≥2:1 (ideally 3:1) | Ensures profitability even with modest win rates |
| Position‑size method | Dollar‑risk ÷ (stop‑loss in pips × pip value) | Translates abstract risk into concrete lot size |
So, what should you do next? Grab your demo account, pick a recent trade idea, and run through the checklist above. Record the risk amount, calculate the lot size, set a stop, and note the potential reward. Then watch the trade play out – without risking more than a couple of percent of your balance.
Remember, risk management isn’t a one‑off task; it’s a habit you repeat on every single trade. The more you practice, the more it becomes second nature, and the less you’ll feel the sting of a losing streak.
Bottom line: you can spend years perfecting chart patterns, but if you never master position sizing and reward‑to‑risk planning, the market will eventually eat your capital. Treat risk like the foundation of a house – without a solid base, everything else crumbles.
Step 5: Advanced Technical Analysis and Multi‑Timeframe Strategies
Now that you’ve nailed position sizing and basic chart patterns, it’s time to add another layer of confidence – looking at the same pair on several timeframes.
Why does a top‑down view matter? Think of the market as a river: the daily chart shows the main current, while the 4‑hour and 15‑minute charts reveal the eddies and rapids that can make or break a trade. When the larger current is flowing up, you’ll want to ride with it; trying to paddle against it on a short chart usually ends in a wipe‑out.
Step 1 – Pick three timeframes that fit your style
Most traders follow the “rule of four”: choose a long‑term, a medium‑term, and a short‑term chart, each roughly four times the length of the next. For a swing‑trader, a weekly chart (long), a daily chart (medium) and a 4‑hour chart (short) work well. Day‑traders might use a daily, 1‑hour and 15‑minute combo. The idea is to get a big‑picture bias and then zoom in for entry.
Investopedia explains that using three periods gives a “broad enough reading” without drowning in redundant data. Read more about the rule of four here.
Step 2 – Identify the dominant trend on the highest timeframe
Start with the highest chart. Look for higher highs and higher lows for an uptrend, or lower lows and lower highs for a downtrend. You can also draw a simple trend line or apply a 20‑period moving average to confirm the direction.
In a recent EUR/USD weekly chart, the pair has been carving higher lows since early 2024, signaling a long‑term bullish bias. Even if the 4‑hour chart flashes a brief dip, the weekly trend tells you the dip is likely a pull‑back, not a reversal.
Step 3 – Find confluence on the medium‑term chart
Switch to the medium chart and look for price‑action clues that line up with the higher‑timeframe bias. Common tools are support/resistance zones, Fibonacci retracements, or a moving‑average crossover.
When those zones line up with the trend, you have “confluence.” ColibriTrader describes confluence as “multiple, independent reasons that point to the same conclusion.” Learn more about confluence trading. For example, a 50‑day SMA touching a historic resistance that also matches a 61.8 % Fibonacci level gives three separate confirmations.
Step 4 – Pinpoint the entry on the short‑term chart
Now drop down to the shortest timeframe. Here you watch for the exact candle pattern or breakout that fits the bias you already have. A bullish engulfing right at a medium‑term support, or a break of a short‑term trend line, can be your entry trigger.
Set your stop just beyond the nearest contradiction point – often the next swing low in an uptrend or the swing high in a downtrend. Because the higher charts already gave you a directional edge, you can keep the stop tighter than you would on a single‑timeframe trade.
Step 5 – Create a quick checklist
- Long‑term bias: up, down, or neutral?
- Medium‑term confluence: which zones, indicators, or patterns line up?
- Short‑term entry signal: what candle or breakout will you use?
- Stop‑loss placement: where does the trade lose its premise?
- Target: is it the next major resistance/support or a risk‑to‑reward ratio of at least 2:1?
Running this checklist before you click “buy” turns a vague hunch into a repeatable process.
Let’s walk through a quick real‑world example. You’re watching GBP/JPY on a daily chart and see a clear uptrend. On the 4‑hour chart, price respects a long‑standing horizontal support at 150.00, and the 20‑EMA is also sitting just above that line. You add a Fibonacci retracement from the recent swing low to high, and the 61.8 % level lands right at 150.00 – that’s three points of confluence. Switching to the 30‑minute chart, a bullish engulfing candle forms at 150.10. You place a stop at 149.80 (just below the support) and a profit target near the next resistance at 152.00, giving roughly a 2.5:1 reward‑to‑risk.
Because each timeframe confirmed the same story, you’ve reduced the odds of a false signal. If the price had broken the 150.00 support on the 4‑hour chart, you’d have stayed out, even if the 30‑minute candle looked tempting.
What’s the biggest mistake traders make here? Trying to trade the short‑term chart without checking the higher frames. That’s why the top‑down approach is called “trading with the market’s current,” not against it.
Finally, remember that multi‑timeframe analysis isn’t a one‑size‑fits‑all formula. Adjust the frame choices based on how long you plan to hold a position, and always respect your risk rules from the previous sections.
Step 6: Trading Psychology and Building a Sustainable Trading Plan
Let’s face it, the charts can feel like a roller‑coaster and the emotions that ride with them are even wilder. If you’ve ever found yourself staring at a candle and thinking “maybe I should just stay in” or “I can’t afford to miss this move”, you’ve already met the first hurdle of trading psychology.
In a solid forex trading guide, the technical side is only half the story. The other half is a set of habits that keep you from letting fear or greed dictate the outcome. Think of it as a personal rulebook you consult before you even open the platform.
Step 1 – Write a simple trading plan and stick to it. Your plan should answer three questions: what you’ll trade, how you’ll enter, and how you’ll exit. It doesn’t need to be a novel; a bullet‑point list on a sticky note works just as well. The key is that every trade you take can be traced back to a rule you wrote down beforehand.
Step 2 – Define your risk‑per‑trade. Most disciplined traders never risk more than 1‑2 % of their account on a single position. That figure might feel tiny when you’re starting with a demo balance, but it protects you from a string of losses that could wipe you out before you’ve had a chance to learn.
Step 3 – Pre‑set your stop‑loss and take‑profit levels before you click “buy” or “sell”. When the market moves, you won’t be scrambling to decide whether to cut losses or let a winner run. A well‑placed stop turns a losing trade into a controlled event, and a realistic profit target gives the trade a clear purpose.
Step 4 – Keep a trading journal that records more than just price and size. Jot down the emotion you felt entering the trade, any distractions you had, and whether you followed your plan. Over weeks you’ll start seeing patterns – maybe you tend to over‑size positions after a big win, or you skip the stop when the market looks “quiet”. Spotting those habits is the first step to fixing them.
Does this sound like a lot of paperwork? It isn’t. The journal can be a simple spreadsheet or even a notebook. The real power shows up when you review it at the end of each week. Ask yourself: did I break any rules? If yes, why? Did the outcome justify the deviation? This reflective loop is what separates a hobbyist from a professional.
Step 5 – Build a pre‑trade routine that puts your brain in “trading mode”. A few deep breaths, a glance at the economic calendar, and a quick scan of your plan can calm the nervous system. Many traders find that a short meditation or a quick walk around the room reduces the impulse to chase a breakout that doesn’t meet their criteria.
Step 6 – Treat losses as data, not failures. The market will be right more often than you are. When a trade hits the stop, note the market condition, the timeframe, and the reason you entered. Over time you’ll see that some setups simply have a lower edge. You can then prune them from your strategy without feeling like you’ve “lost” anything.
As Dukascopy explains, disciplined traders protect their capital by pre‑committing to stop‑losses and sticking to a written plan, which dramatically improves long‑term survivability. trading discipline
If you’re wondering how to turn those bullet points into a full‑fledged document, IG’s guide on creating a successful trading plan breaks the process into seven easy steps, from defining your motivation to setting SMART goals and choosing the right timeframes. successful trading plan
Quick checklist to get you moving right now:
- Write down the currency pair, timeframe, and entry criteria.
- Set risk per trade at ≤2 % of equity.
- Place stop‑loss and profit target before entry.
- Record emotion and any rule breaches in your journal.
- Review the journal weekly and adjust the plan accordingly.
Remember, the goal isn’t to eliminate emotions – that’s impossible – but to give them a structure so they don’t hijack your decisions. Over weeks of consistent practice you’ll notice the “gut feeling” becoming a calmer, more informed voice. That’s the sweet spot where psychology and a sustainable trading plan meet, and it’s the foundation that lets you keep trading for the long haul.
FAQ
What’s the most practical first step to create a solid forex trading plan?
Start by writing down three simple things: which currency pair you’ll trade, the exact entry criteria you’ll use, and the stop‑loss and profit‑target rules that will govern each trade. Keep the language plain – think of it as a cheat‑sheet you could read in a coffee break. Once you have that skeleton, you can flesh it out with risk‑per‑trade limits and a short‑term review routine.
How much of my account should I risk on any single trade?
Most educators, including us at FX Doctor, recommend a risk range of 1‑2 % of your total equity per trade. If you have a $5,000 demo balance, that means you’d risk $50‑$100 at most. This tiny slice protects you from a string of losses and leaves enough capital to keep learning. Adjust the percentage only as your confidence and account size grow, never the other way around.
Why is keeping a trading journal so important?
A journal does more than record price and size – it captures the emotions you felt entering and exiting a trade. By noting whether you were nervous, over‑excited, or calm, patterns emerge that you can correct. Over weeks you’ll see which setups consistently work and which ones you’re tempted to chase. That self‑audit turns vague feelings into concrete data you can actually act on.
What’s the real difference between a market order and a limit order?
A market order says “fill me now at the best price,” so you get instant execution but you also inherit the current spread and any slippage. A limit order, on the other hand, tells the platform “only fill me at this price or better.” It protects you from paying too much, but you might miss the move if the market never reaches your level. Use market orders for time‑critical entries and limit orders when you can afford to wait.
How can I incorporate multiple timeframes without getting confused?
Pick a three‑frame stack that matches your style – for example, weekly (big picture), daily (medium bias), and 4‑hour (entry timing). Start by identifying the trend on the weekly chart, then look for confluence on the daily, and finally pinpoint the exact candle or breakout on the 4‑hour. If any frame contradicts the higher‑timeframe bias, step back. This top‑down hierarchy keeps the process disciplined and prevents analysis paralysis.
When should I adjust my position size for market volatility?
If the average true range (ATR) or recent pip swing widens, increase the distance to your stop‑loss accordingly and shrink the lot size so the dollar risk stays constant. Conversely, on a calm day you can tighten the stop and keep the same risk amount, which often lets you stay in the trade longer. The key is to recalculate before each new setup; treat volatility as a variable, not a fixed number.
Where can I find trustworthy, up‑to‑date learning material to keep improving?
Beyond the core articles on the FX Doctor blog, consider reputable educational hubs that focus on fundamentals, like the central bank’s market‑watch sections or well‑known finance portals that publish unbiased research. Look for resources that break concepts into bite‑size lessons, include downloadable worksheets, and avoid any “guaranteed profit” language. Pair that reading with regular practice on a demo platform, and you’ll keep sharpening your edge without chasing shortcuts.
Conclusion
We’ve walked through the whole forex trading guide, from the basics of major pairs to the nitty‑gritty of multi‑timeframe confluence.
So, what does it all mean for you? It means you now have a repeatable checklist you can pull up before every demo trade.
Remember the three‑step risk rule – 1‑2 % per trade, size your position, and respect your stop. Those habits protect your account long after the excitement fades.
And the psychology part? Treat each loss as data, not a personal failure. Write a quick journal note, spot the pattern, then adjust.
When you line up the weekly trend, the daily confluence, and the 4‑hour entry candle, you’re essentially letting the market tell you the story instead of forcing a narrative.
Does this feel like a lot? Take it one step at a time. Start with a single pair, practice the checklist for a week, and watch the confidence grow.
Finally, the best way to cement everything is to keep learning – the FX Doctor blog constantly updates its resources, so you’ll never run out of fresh material to test.
Ready to turn knowledge into habit? Open your demo platform, apply the process, and let the results speak for themselves.
Stick with the plan, review weekly, and watch your confidence solidify.
[…] a deeper dive into how these tools fit into a broader trading plan? Check out our Comprehensive Forex Trading Guide for Beginners and Beyond, where we walk through setting up sentiment dashboards step by […]