
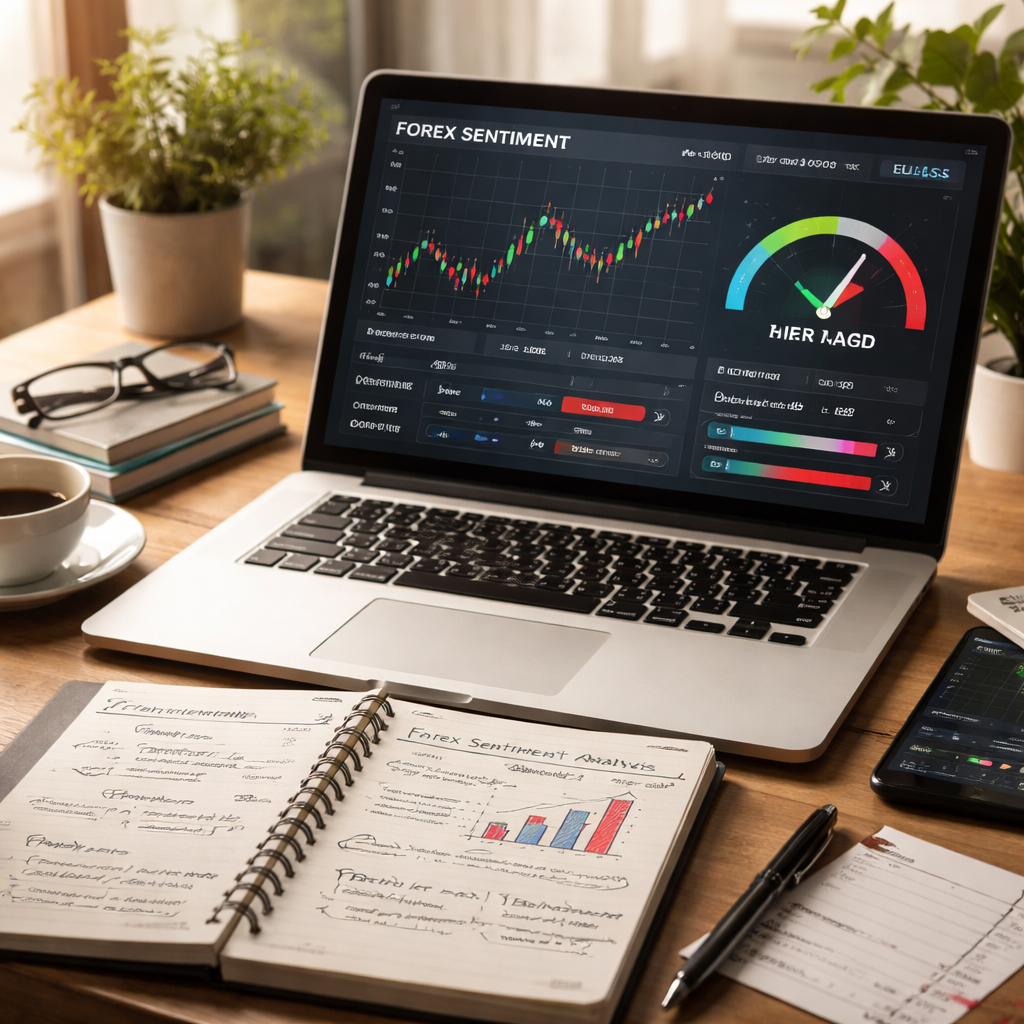
Forex market sentiment analysis is the heartbeat of anyone who wants to read the crowd.
Most beginners focus on raw numbers and ignore how traders feel about news, risk or profit.
That feeling shows up in price spikes, volume surges and the way bids and asks stack up.
If you can spot whether the market leans bullish or bearish, you gain a clearer edge before you even place a trade.
In this guide we’ll break down the simple tools you can use, from sentiment indexes to trader-position data, and show how to turn vague emotion into concrete clues.
You’ll learn why a sudden rise in long positions often means a crowd is getting nervous, and how a drop in short interest can signal a hidden strength.
We’ll also point out common traps, like mistaking a short-term panic for a long-term trend, so you avoid costly overreactions.
By the end you’ll have a step-by-step routine you can add to your daily prep, no matter if you trade the EUR/USD or exotic pairs.
Stop guessing and start reading the market’s mood. The basics are next.
Step 1: Identify Sentiment Drivers
First, you need to spot what moves the crowd.
Look at the news that traders talk about. Economic releases, central‑bank hints, or a geopolitical flash can push feelings up or down.
When a headline spikes, check the order flow. A surge in buys often means optimism, while a flood of sells can hint at fear.
You can also read the sentiment indexes that many brokers publish. These tools turn trader positioning into a simple number – a bullish reading above 50 or a bearish dip below.
Another cheap clue is the spread. When the bid‑ask gap widens, traders are nervous; a tight spread usually means confidence.
Now pull these signals together. If the news is upbeat, the order flow is buying, the sentiment index sits high, and the spread stays tight, you’ve got a clear bullish driver.
Watch the short clip below for a quick walk‑through of how to read a live sentiment chart.
After the video, grab a fresh chart and mark the three things we just covered. Write down the headline, the net position number, and the spread width. This simple checklist helps you see the mood at a glance.
Remember, sentiment changes with the session. A Euro‑dollar move may feel different in the London morning than in the New York close. Adjust your driver list for each major session to keep the picture fresh.
Tip: run this routine every morning before the market opens. It only takes five minutes, but it can save you from trading on a blind guess. You’ll start to see patterns that most beginners miss.

Step 2: Gather Sentiment Data Sources
Before you trust any number, you need a few different feeds. One feed might say the market is 70% long, another might show a 55% split. When they line up, you get confidence.
Start with the retail‑client ratios many brokers publish. Those numbers only cover small traders, so they often move opposite to the big money. The FXSSI Sentiment tool pulls data from several brokers, weights each source, and shows a blended buyer‑to‑seller ratio. A reading above 60% buyers usually hints that a sell move could be coming, while below 40% suggests buying pressure.
Next, add a news‑sentiment monitor. Simple services score headlines as bullish or bearish. Pair that with the economic calendar – you’ll see if a surprise rate decision is behind a spike in sentiment. Finally, glance at the Commitment of Traders (COT) report for a longer‑term view of large trader positions.
Quick checklist
- Open the broker client‑ratio page for your pair.
- Load the FXSSI web tool and note the blended %.
- Check a news‑sentiment widget for the same hour.
- Mark the COT data if it’s available.
Watch this short video for a visual walk‑through of how the FXSSI panel updates in real time.
Once you have the numbers, write a quick note in your trading journal. If you’re looking for a tool to keep that habit steady, the habit‑tracker app Askesis helps you set daily sentiment‑check reminders and see streaks grow.
Staying sharp can be tiring. The Exuvital supplement line is built to support focus and calm, which many traders say helps them read market mood without feeling jittery.
For a deeper dive on which indicators work best, see our guide Forex Market Sentiment Indicators: A Practical Guide for Traders. Pulling several sources together turns a vague feeling into a solid data point you can act on.
Step 3: Analyze Sentiment with Technical Tools
Now you have the raw sentiment numbers, it’s time to see how they behave on a price chart. A visual view lets you spot if the crowd’s mood matches the market’s direction.
Pick a chart type you trust
Most traders start with a candlestick chart because it shows each period’s open, high, low and close in a quick glance. You can also use a line chart if you prefer a cleaner look.
Overlay a sentiment indicator
Many platforms let you add a sentiment line – for example the blended buyer‑to‑seller % from FXSSI. Plot it on the same time frame as your price chart. If the line climbs while price stalls, you might be seeing buying pressure that hasn’t yet pushed the market.
Look for price‑pattern clues
Technical patterns often echo the market’s feeling. An ascending triangle, for instance, suggests buyers are still strong even if price is stuck. A head‑and‑shoulders shape can flag a shift from bullish to bearish sentiment. The price pattern guide explains how each shape reflects trader psychology.
Check the breakouts
When a pattern breaks, compare the breakout direction to the sentiment line. A bullish breakout with a rising sentiment line reinforces the move. A bearish breakout while sentiment stays flat or falls warns you to watch for false signals.
Record the observation
In your journal, note the pair, time frame, pattern type, sentiment level and what you think it means. Over weeks you’ll see if certain patterns plus sentiment spikes lead to reliable moves.
That’s it – a quick, visual loop that turns raw numbers into a clearer trading edge.
Step 4: Combine Sentiment with Risk Management
Now that you can read the crowd, you need to tie that feeling to how much you risk on each trade.
First, ask yourself if the market is in a risk-on or risk-off mode. In risk-on sessions traders chase higher-yielding assets; in risk-off periods money flows to safe havens. The OANDA guide explains how these flows shape price moves.
Turn the sentiment line into a risk filter
If the sentiment line climbs above 70 % long while the market is risk-on, you might increase size but keep a tighter stop. If sentiment spikes the other way in a risk-off swing, consider a smaller position or stay out.
Use a risk-assessment dashboard
The forexsentiment.live signal board adds a risk rating to each pair. A high rating signals possible volatility, so tighten stops or cut size. A low rating lets you be a bit more relaxed.
Quick checklist
- Identify market flow: risk-on, risk-off, or neutral.
- Match sentiment strength to flow.
- Adjust position size, larger when sentiment and flow agree, smaller when they clash.
- Set stop loss based on the risk rating you see.
- Record the decision in your journal.
After each session, glance back at your notes. Look for patterns where a strong sentiment matched a high risk rating and the trade performed well. Over time those repeats become a personal rule book you can trust.
By pairing mood with a clear risk rule, you stop letting emotion drive the trade. The crowd’s feeling becomes a data point that tells you how much to risk.
Remember, risk management protects your capital even when sentiment turns against you.
Try this routine for a week. You’ll see if your win-rate steadies when sentiment guides risk instead of the other way around.
Step 5: Interpret Results and Make Informed Decisions
Now you have the numbers and the risk filter. The next move is to turn those bits into a clear trade idea.
First, line up the sentiment % with the risk rating you saw on the dashboard. If sentiment is high and risk is low, you may feel comfortable taking a bit more size. If sentiment spikes while risk is high, think about tightening your stop or cutting the position.
Does that sound like a lot? It isn’t. Just ask yourself: “What does the crowd say, and how risky does the market look right now?” Write the answer in one sentence.
Next, record the decision in your journal. Note the pair, time, sentiment level, risk rating, and the action you chose. After a few weeks, scan the log for repeats – like many times when a 75 % long reading met a low risk score and the trade moved in your favor.
A quick habit check helps you stay objective. Each evening, glance at the day’s sentiment chart, compare it to the risk rating you logged, and ask if the outcome matched your expectation. If it didn’t, write a note on why you think the crowd misread the market.
Use this quick table to decide what to do when the two signals line up.
| Sentiment | Risk Rating | Typical Action |
|---|---|---|
| High ( >70% long) | Low | Increase size, keep normal stop |
| High | High | Keep size small, tighten stop |
| Low ( <30% long) | Low | Consider short trade, normal stop |
| Low | High | Stay out or use very tight stop |
Remember, the goal isn’t to chase every extreme reading. It’s to let the combination of sentiment and risk act as a filter that tells you when a trade feels too risky. Over time the filter will sharpen your edge.
Try this routine for a week. When you see the pattern repeat, you’ll trust the crowd less as a feeling and more as a data point that guides each move.
Conclusion
You’ve seen how forex market sentiment analysis can turn a vague feeling into a clear trade filter.
First, grab the sentiment % and the risk rating each day. Then ask yourself: does the crowd feel bullish while risk stays low? If yes, you might let a slightly larger position ride.
If the crowd is extreme and risk looks high, keep the size small or stay out. The simple table you built earlier helps you decide in seconds.
Remember, the goal isn’t to chase every peak reading. It’s to let the combo of mood and risk act as a guard that tells you when a trade feels too risky.
Try the routine for a week. When the pattern repeats, you’ll trust the data point more than a gut feeling and your edge will sharpen.
Keep a short note each night about what the crowd did and how the risk looked. Over time that log becomes your personal compass.
FAQ
What is forex market sentiment analysis?
Forex market sentiment analysis is the practice of reading how traders feel about a currency pair. It looks at the balance of long versus short positions, news tone, and risk appetite. When more traders are bullish, the sentiment number rises; when they turn cautious, it falls. By watching these shifts you get a clue about possible price moves before they happen.
How can I get sentiment data for free?
You can pull sentiment data without paying a cent. Most brokers publish a client‑ratio page that shows the percentage of buyers vs sellers for major pairs. Sites like the SWFX Sentiment Index on Dukascopy update every half hour and are free to view. A quick glance at those numbers each morning gives you a baseline for your trade plan.
How often should I check sentiment numbers?
Check the sentiment gauge at least twice a day – once when the Asian session opens and again after the European close. Those two points capture the main swings in trader mood. If you have more time, add a quick look during the US session for a final check. Consistency beats occasional deep dives. When the sentiment line moves sharply between those checks, note the direction and think about how it fits your risk view. A stable reading suggests the crowd’s mood isn’t changing, which can be a good sign to stick with your plan.
How do I combine sentiment with a risk rating?
First, look at the sentiment % and the risk rating side by side. If the crowd is strongly bullish (above 70 % long) and the risk gauge shows low volatility, you might raise your position size a bit while keeping a normal stop loss. If the sentiment is extreme but risk is high, trim the size or stay out. The key is to let the two numbers confirm or clash before you act.
What are common traps to avoid?
A common trap is to treat every extreme reading as a trade signal. The crowd can stay overbought for days, and jumping in each time drains your account. Another pitfall is ignoring the overall market flow, risk‑on vs risk‑off, which can flip the meaning of sentiment. Keep a simple rule: only act when sentiment and risk line up, and always record why you entered.
How can I track my sentiment analysis routine?
Build a tiny log that you fill out after each session. Write the pair, time, sentiment %, risk rating and the action you took. Over a few weeks scan the table for patterns, like many times a 75 % long reading with low risk led to a smooth move. Seeing those repeats helps you trust the process and spot when the crowd’s mood is losing steam.