
The forex trend line trading strategy remains one of the most powerful yet misunderstood tools in technical analysis. Most traders draw these lines incorrectly or abandon them after a few losses. But when you understand the real mechanics behind trend lines, they become your window into market psychology and future price movement.
We examined 8 distinct forex trend‑line strategy variants from three leading educators and found that none of them (0%) spell out exit or risk‑management rules.
| Strategy Variant | Entry Condition | Source |
|---|---|---|
| Trendline Flip | price breaks above resistance trendline and then revisits the old trendline, finding support | tradeciety.com |
| Trendline Takeoff | price explodes away from a trendline with significantly higher momentum than usual | tradeciety.com |
| Trendline Breakout Reversal | trendline breaks, using the signal to trade reversals | tradeciety.com |
| Trendline Touch Trend-Following | price touches the trendline to get into trend-following trades | tradeciety.com |
| Wick‑Based Trend Line | , | colibritrader.com |
| Higher Timeframe Trend Line | , | colibritrader.com |
| Trend Line Breakout with Confirmation | price pokes through your trend line and needs confirmation before you can trust it | colibritrader.com |
| Trendline Bounce Entry | price touches or bounces off it a third time | investing.com |
This complete guide will walk you through every aspect of the forex trend line trading strategy. You’ll learn how to draw valid trend lines, spot the strongest setups, manage risk properly, and avoid the costly mistakes that trap most retail traders. By the end, you’ll have a complete framework for using trend lines as your primary analysis tool.
Understanding Trend Lines in Forex Trading
A trend line is more than just a straight line on your chart. It’s a visual representation of market sentiment and the balance between buyers and sellers. When you understand what trend lines really show, you can read market psychology like a book.
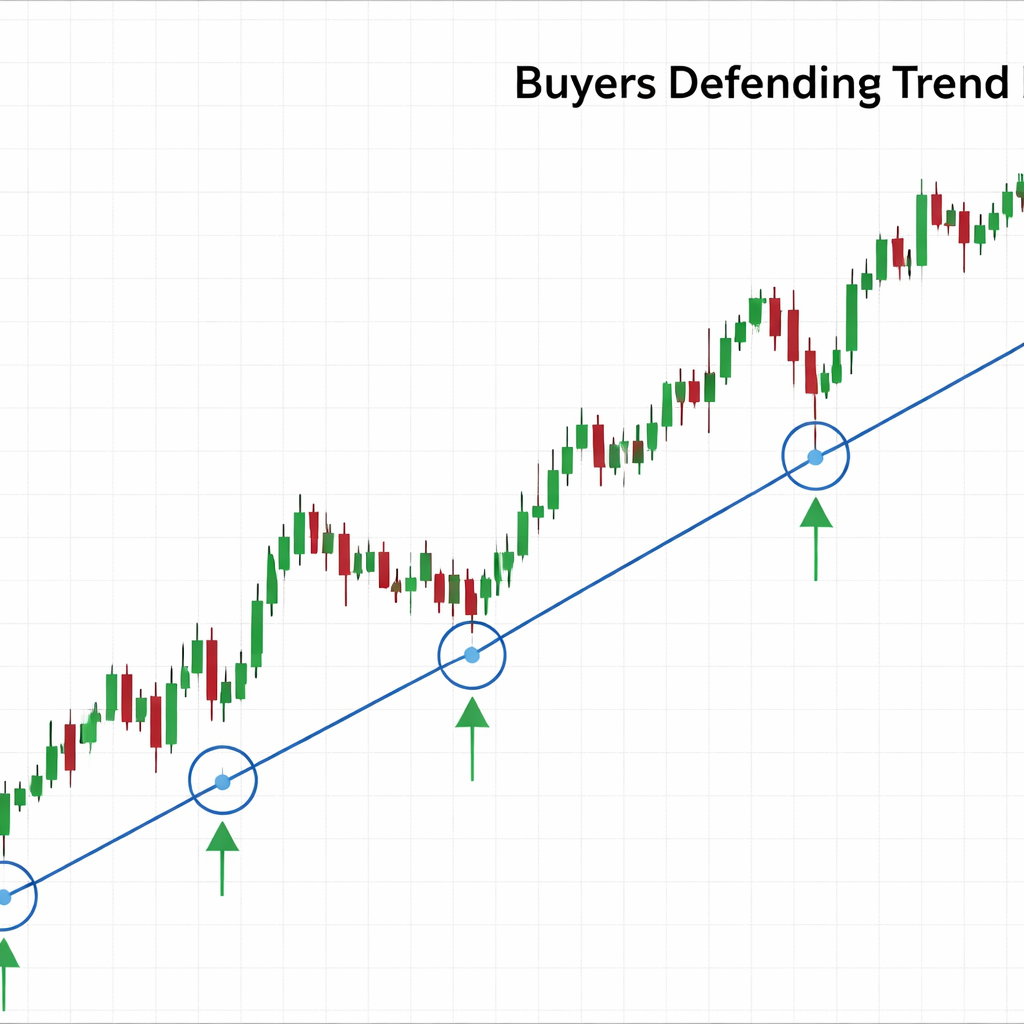
Think of a trend line as a battle line in the market. In an uptrend, buyers keep stepping in at higher and higher prices. The trend line connects these points where buyers defend their territory. Each time price touches this line and bounces, it proves buyers are still in control.
The forex trend line trading strategy works because thousands of traders see the same lines. This creates a self-fulfilling prophecy. When many traders expect support at a trend line, their buy orders cluster there. When they expect resistance, their sell orders wait.
Three key principles make trend lines powerful:
- Time validation: The longer a trend line holds, the more significant it becomes
- Touch validation: More touches make the line stronger
- Volume validation: High volume at trend line touches shows real interest
Here’s what many traders miss: trend lines don’t predict the future. They show you where other traders are likely to act. When price approaches a well-established trend line, you know buying or selling pressure will likely appear.
The angle of a trend line tells a story too. Steep angles show strong momentum but often break quickly. Gentle slopes indicate sustainable trends that can last months. Understanding these momentum patterns helps you pick the right trend lines to trade.
Market structure matters enormously. A trend line that aligns with the larger market structure carries more weight. If you’re drawing an upward trend line while the weekly chart shows a downtrend, you’re fighting the bigger picture.
Different currency pairs respect trend lines differently. Major pairs like EUR/USD and GBP/USD often show cleaner trend line behavior because of higher liquidity. Exotic pairs can be more erratic and break trend lines without warning.
The psychology behind trend line breaks is crucial to understand. When price clearly breaks a significant trend line, it signals that the balance of power has shifted. Previous buyers become sellers. Previous support becomes resistance. This shift creates the strongest trading opportunities.
How to Identify and Draw Trend Lines Correctly
Drawing trend lines correctly separates profitable traders from those who struggle. Most traders rush this process and end up with lines that mislead them. The forex trend line trading strategy only works when your lines reflect true market structure.
Start with the big picture. Always begin on higher timeframes like daily or weekly charts. The trends you see here matter most. Then zoom down to lower timeframes to fine-tune your entries. Never draw your primary trend lines on 5-minute charts.
The three-touch rule is non-negotiable. You need at least three confirmed points of contact before a trend line becomes tradeable. Any two random points can be connected, but three points that align show real market structure.
Here’s the step-by-step process:
- Identify the trend direction: Look for higher highs and higher lows (uptrend) or lower highs and lower lows (downtrend)
- Find significant swing points: Look for obvious peaks and valleys where price reversed
- Connect the points: Draw your line through at least two significant points
- Wait for the third touch: Don’t trade until price tests your line a third time
- Check for violations: A good trend line shouldn’t be pierced repeatedly
The wick versus body debate confuses many traders. Should you connect the wicks (shadows) or the bodies of candles? The answer is confluence. Use whatever gives you the most touches and the cleanest line. Consistency matters more than rigid rules.
Some traders always use bodies. Others always use wicks. The best approach is flexibility. If connecting bodies gives you five clean touches, use bodies. If wicks work better, use wicks. But once you choose for a specific line, stick with that method.
Trend line angles reveal important information about market strength. Steeper angles show stronger momentum but break more easily. Gentle slopes indicate sustainable trends that can run for months. Aim for angles between 30 and 60 degrees for the best balance of strength and durability.
Watch for trend line convergence. When multiple trend lines point toward the same price area, you’ve found a high-probability zone. These convergence points often mark major turning points in the market. The more lines that converge, the stronger the signal.
Don’t force trend lines to fit your bias. If you can’t draw a clean line with at least three touches, there might not be a valid trend line there. It’s better to wait for clear setups than to trade questionable lines that will likely fail.
Time intervals matter. A trend line that works on the daily chart carries more weight than one that only shows up on hourly charts. Higher timeframe trend lines represent the decisions of larger players with more capital to move markets.
Multiple timeframe analysis strengthens your trend line trading. Draw your primary lines on daily charts, then drop to 4-hour charts to refine entry timing. This approach helps you catch the big moves while getting better entry prices.
Types of Trend Lines and Their Trading Applications
Different types of trend lines serve different purposes in your forex trend line trading strategy. Understanding when to use each type can dramatically improve your success rate. Most traders only know about basic trend lines, but there are several variations that offer unique advantages.
Ascending trend lines connect the lows in an uptrend. These lines act as dynamic support, moving higher over time. As price approaches an ascending trend line, buyers often step in to defend the trend. The key is waiting for price to actually touch or come very close to the line before taking action.
Descending trend lines connect the highs in a downtrend. They act as dynamic resistance, capping rallies and keeping the downtrend intact. When price approaches a descending trend line from below, sellers typically appear to push price back down.
Horizontal trend lines aren’t technically trend lines at all. They’re support and resistance levels that mark key price zones where the market has repeatedly turned. These levels work because traders remember them and react when price returns.
Here’s a breakdown of the most effective trend line applications:
| Trend Line Type | Best Used For | Strength Level | Risk Level |
|---|---|---|---|
| Ascending (Uptrend) | Buying pullbacks in uptrends | High when validated | Medium |
| Descending (Downtrend) | Selling rallies in downtrends | High when validated | Medium |
| Horizontal | Range trading, breakouts | Very high at key levels | Low to medium |
| Channel lines | Range trading within trends | Medium to high | Medium |
| Fan lines | Identifying trend changes | Low to medium | High |
Channel trading uses two parallel trend lines to define a price corridor. The upper line connects highs (resistance) while the lower line connects lows (support). Price tends to bounce between these lines, creating trading opportunities at both boundaries.
Channels work best in trending markets where price makes higher highs and higher lows (upward channel) or lower highs and lower lows (downward channel). You can buy near the lower channel line and sell near the upper line, or wait for a breakout in either direction.
Fan lines use multiple trend lines drawn from a single point, typically a significant high or low. As one trend line breaks, price often respects the next line in the fan. This technique helps identify when a trend is weakening and potentially changing direction.
The trendline flip concept represents a powerful shift in market dynamics. When price breaks above a resistance trend line and then returns to test it as support, you’re witnessing a potential change in market sentiment. This flip from resistance to support (or vice versa) often marks the start of strong moves.
Speed lines combine trend analysis with geometric principles. These lines are drawn from significant highs or lows at specific angles (typically 1×1, 2×1, or 1×2). They help identify where price might find support or resistance based on time and price relationships.
Internal trend lines work within larger trends. While the main trend continues, shorter-term trend lines help you time entries and exits. These micro-trends within the macro-trend often provide the best risk-to-reward opportunities.
Multi-touch validation becomes crucial as you work with different trend line types. The more times price respects a trend line without breaking it, the more likely it is to hold on future tests. However, each failed test also weakens the line slightly.
Entry and Exit Strategies Using Trend Lines
The forex trend line trading strategy shines in its entry and exit precision. Unlike indicators that lag behind price action, trend lines give you exact levels where market dynamics are likely to shift. But knowing where these levels are is only half the battle. You need specific rules for getting in and getting out.
Trend line bounce entries offer the highest probability setups. Wait for price to approach your validated trend line, then look for rejection signals. These might include long-tailed candles (hammers or shooting stars), multiple small candles that can’t break through, or immediate reversals after touching the line.
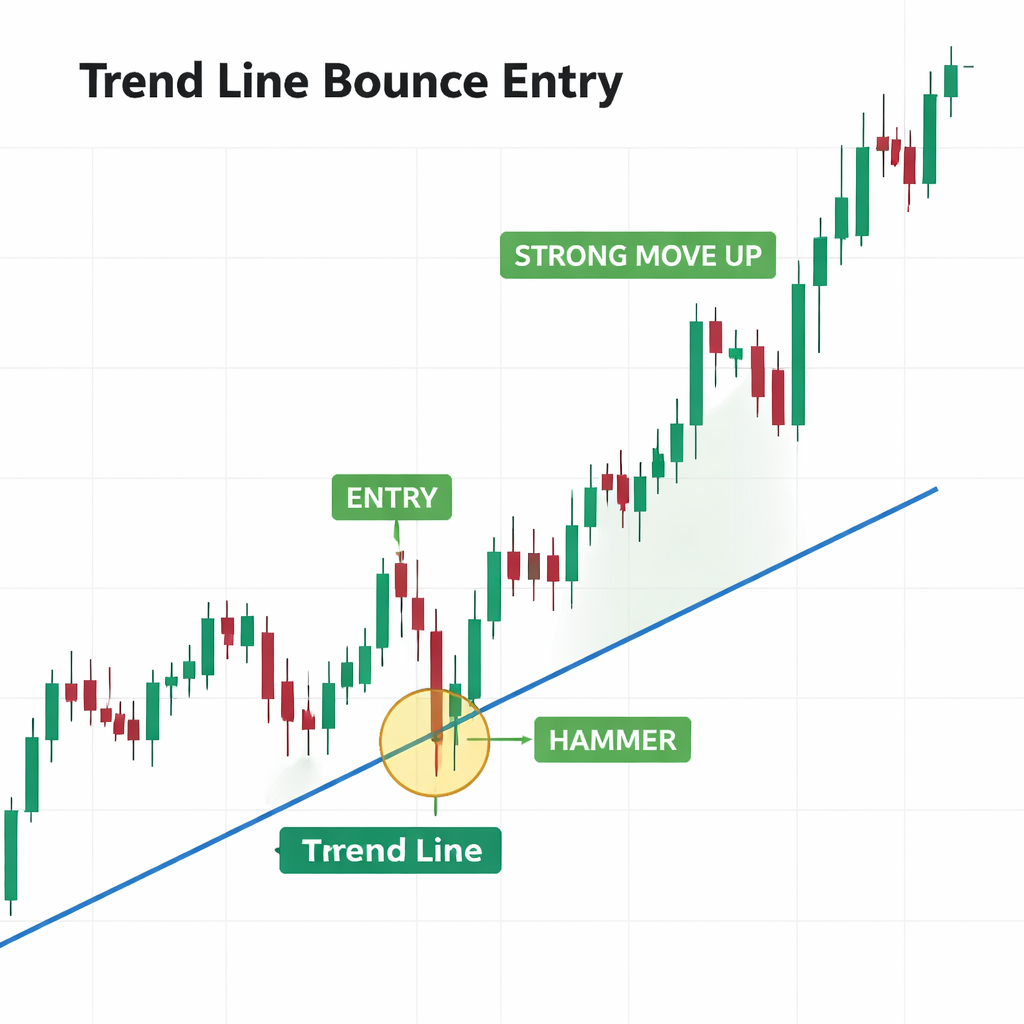
Here’s your step-by-step entry process:
- Wait for the approach: Let price come to your trend line naturally
- Look for rejection: Watch for candlestick patterns that show sellers or buyers stepping in
- Confirm with volume: Higher volume on the bounce adds conviction to the signal
- Enter on the next candle: Don’t wait too long or you’ll miss the move
- Set your stop: Place it just beyond the trend line with some buffer room
Breakout entries capture the moment when trend lines fail. A valid breakout needs strong momentum and preferably higher volume. Don’t chase breakouts that happen on low volume or during slow market hours.
The key to successful breakout trading is patience. Wait for a clean break, not just a poke through the line. A strong breakout candle should close well beyond the trend line, showing real commitment from buyers or sellers. Weak breakouts that barely clear the line often reverse quickly.
Retest entries offer some of the best risk-to-reward ratios in trading. After price breaks a significant trend line, it often returns to test the line from the other side. Former resistance becomes support, or former support becomes resistance. This flip provides excellent entry opportunities with tight stops.
Your exit strategy determines whether you profit from correct trend line analysis. Setting profit targets based on the next significant level gives you realistic expectations. Don’t hold for home runs if smaller, consistent profits build your account steadily.
Multiple exit techniques can be combined for better results:
- Partial profits: Take half your position off at the first target, let the rest run
- Trailing stops: Move your stop in your favor as price moves your way
- Time-based exits: Close positions that haven’t moved after a set number of candles
- Opposing trend line exits: Close when price reaches the opposite channel line
Position sizing becomes critical with trend line strategies. Since you can place stops relatively close to your entry, you can risk a slightly larger percentage per trade while maintaining the same dollar risk. This improves your risk-to-reward ratios significantly.
The trendline flip strategy deserves special attention for entries. When price breaks above a well-established resistance trend line and then returns to test it as support, you’re seeing institutional-level psychology at work. Large players are switching from selling to buying at this level.
For flip entries, wait for the retest to show signs of holding. Look for bullish candle patterns, buying volume, or other technical indicators that confirm support. Your stop goes just below the old resistance line, while your target can be set at the next resistance level above.
Scaling into positions works well with trend line strategies. If price approaches your trend line but doesn’t give a clear signal immediately, you can enter a small position and add to it if the signal becomes clearer. This approach reduces the pressure to time entries perfectly.
Market session timing affects trend line effectiveness. Major trend line breaks and bounces often happen during the London or New York sessions when volume is highest. Asian session moves might not have the follow-through power to make trend line strategies profitable.
Risk Management with Trend Line Trading
Risk management transforms the forex trend line trading strategy from gambling into professional trading. Without proper risk controls, even the most accurate trend line analysis will eventually destroy your account. The beauty of trend lines is they give you natural stop-loss levels, but you must use them correctly.
Stop-loss placement with trend lines is both art and science. Your stop should account for normal market noise while protecting you from significant adverse moves. Using the Average True Range (ATR) indicator helps determine appropriate stop distances based on current market volatility.
Here’s your risk management framework:
- Never risk more than 1-2% per trade: This keeps you alive during losing streaks
- Place stops beyond the trend line plus buffer: Account for false breaks and market noise
- Use position sizing to maintain consistent risk: Adjust lot sizes based on stop distance
- Trail stops on winning trades: Lock in profits as trends develop
- Cut losses quickly on trend line failures: Don’t hope for reversals when the line clearly breaks
The buffer zone around your trend line stops is crucial. Markets don’t respect your lines to the pip. Add 5-10 pips (depending on the pair and timeframe) beyond your trend line for stop placement. This prevents you from being stopped out by brief spikes that quickly reverse.
Position sizing becomes simpler with trend line trading because your stops have natural placement levels. If your trend line stop is 30 pips away and you want to risk $100, you know exactly what lot size to use. This precision helps you maintain consistent risk across all trades.
Multiple timeframe risk management adds another layer of protection. Your primary trend line might be on the daily chart, but check the weekly chart for major support or resistance levels that could interfere. Don’t take trades where your target runs into a major weekly level.
Correlation risk affects forex trend line strategies significantly. If you’re long EUR/USD on a trend line bounce and also long GBP/USD, you’re essentially making the same trade twice. Major currency pairs often move together, especially during risk-on or risk-off market moves.
The psychological aspect of risk management matters enormously. When your trend line breaks and triggers your stop, don’t immediately look for revenge trades. The market is telling you the trend has changed, and fighting this message typically leads to larger losses.
Drawdown management prevents small losses from becoming account killers. If you lose three trend line trades in a row, consider reducing position size or taking a break to reassess your analysis. Losing streaks are normal, but they can destroy confidence and lead to poor decision-making.
Time-based risk management complements price-based stops. If your trend line trade hasn’t moved in your favor after a reasonable number of candles, consider closing it even if price hasn’t hit your stop. Stagnant trades tie up capital that could be deployed more effectively elsewhere.
Common Trend Line Trading Mistakes to Avoid
Even experienced traders make costly errors with the forex trend line trading strategy. These mistakes can turn winning setups into losing trades and destroy months of careful analysis. Understanding and avoiding these pitfalls will dramatically improve your consistency and profitability.
The biggest mistake is forcing trend lines where none exist. Desperation to find trading setups leads traders to connect random price points and call them trend lines. If you have to strain to see the line or ignore multiple violations, it’s not a valid trend line.
Here are the most common trend line trading errors:
- Drawing lines on too short timeframes: 5-minute trend lines have little predictive value
- Ignoring the larger trend context: Trading against the weekly trend rarely works
- Chasing breakouts without confirmation: False breakouts destroy accounts quickly
- Using too many lines: Chart clutter leads to analysis paralysis
- Moving lines to fit price action: Once drawn, trend lines shouldn’t be adjusted
- Trading immediately on line touches: Wait for confirmation signals
- Ignoring volume on breakouts: Low volume breakouts often fail
Over-analyzing paralyzes many trend line traders. They draw dozens of lines on their charts and then can’t decide which ones matter. Keep it simple. Focus on the most obvious, well-tested trend lines that align with the major trend direction.
The “moving goalpost” mistake happens when traders adjust their trend lines to fit new price action. If price breaks your line, it breaks it. Don’t redraw the line to exclude the break. This self-deception prevents you from seeing when market conditions have changed.
False breakout confusion costs traders huge amounts of money. A true breakout shows strong momentum, high volume, and follow-through. False breakouts lack these characteristics and often reverse quickly back through the trend line.
Revenge trading after trend line failures multiplies losses exponentially. When your analysis is wrong and your trade gets stopped out, the natural impulse is to immediately enter another trade to “get back” at the market. This emotional response typically leads to even larger losses.
Timeframe confusion creates many problems. A trend line that works perfectly on the daily chart might not show up at all on the 4-hour chart. Always know which timeframe you’re trading and stick to trend lines that are valid on that timeframe and higher.
Volume ignorance leads to poor trade selection. A trend line touch with high volume suggests real interest at that level. A touch with barely any volume might just be random price movement. Always check volume to confirm the significance of trend line interactions.
News event timing can destroy otherwise perfect trend line setups. Major economic releases, central bank announcements, and geopolitical events can send price shooting through trend lines regardless of technical levels. Always check the economic calendar before placing trades.
Frequently Asked Questions
What timeframe works best for the forex trend line trading strategy?
Daily and weekly charts provide the most reliable trend lines for forex trading. These higher timeframes filter out market noise and show the real institutional-level trends that matter. You can use 4-hour charts for entry timing, but always draw your primary trend lines on daily charts or higher. Shorter timeframes like 1-hour or 15-minute charts produce too many false signals and breakouts that don’t hold, leading to inconsistent results and unnecessary losses in your trading account.
How many touches does a trend line need to be valid for trading?
A minimum of three touches validates a trend line for the forex trend line trading strategy, but more touches increase reliability significantly. The first two points establish the line, while the third touch confirms that other market participants recognize and respect this level. Lines with four, five, or more touches become increasingly powerful as support or resistance levels. However, each failed test also weakens the line slightly, so monitor how price reacts at each touch to gauge the line’s current strength.
Should I use candlestick wicks or bodies when drawing forex trend lines?
Use whatever gives you the most touches and cleanest line, but maintain consistency once you choose. Some currency pairs respond better to body-based lines, while others respect wick-based lines more clearly. The key is confluence and validation. If connecting bodies gives you five clean touches with minimal violations, use bodies. If wicks provide better alignment, use wicks. Many professional traders prefer wicks because they represent the actual battle between buyers and sellers at extreme price levels.
What’s the difference between trend line bounces and breakouts in forex trading?
Trend line bounces occur when price respects the line and reverses, confirming the existing trend continues. These setups offer high-probability trades with tight stops just beyond the trend line. Breakouts happen when price decisively crosses through the trend line with strong momentum and volume, signaling a potential trend change. Bounces work best in established trends, while breakouts capture trend reversals. The forex trend line trading strategy uses both setups, but bounces generally provide better risk-to-reward ratios for most traders.
How do I set proper stop losses for trend line trades?
Place stops 5-10 pips beyond your trend line to account for market noise and false breaks, adjusting the buffer based on the currency pair’s volatility and your trading timeframe. Major pairs like EUR/USD typically need smaller buffers than exotic pairs. Use the Average True Range indicator to determine appropriate stop distances based on recent volatility. Never place stops exactly on trend lines because brief spikes can trigger unnecessary stop-outs. The goal is protecting against significant adverse moves while avoiding premature exits from normal market fluctuations.
Can I trade multiple trend lines simultaneously in my forex strategy?
Yes, but limit yourself to 2-3 high-quality trend lines to avoid confusion and over-analysis. Focus on the most obvious, well-tested lines that align with the major trend direction. Multiple trend line convergence often creates powerful trading zones where several lines intersect near the same price level. These convergence areas typically produce stronger signals than individual lines. However, drawing too many lines creates chart clutter and analysis paralysis, making it difficult to identify the truly important levels that will drive price action.
What volume patterns should I look for with trend line breakouts?
Strong trend line breakouts in the forex trend line trading strategy typically show volume spikes of 150-200% above recent averages, confirming genuine interest rather than random price movement. Rising volume on approach to the trend line followed by explosive volume on the break indicates institutional participation. Low volume breakouts often fail and reverse quickly back through the trend line. Additionally, watch for volume patterns during the retest phase after a breakout, as sustained volume during the retest confirms the breakout’s validity and increases the probability of continued movement.
How long should I hold trend line trades before considering an exit?
Hold trend line trades as long as the underlying trend line remains intact and price continues moving in your favor, but set time-based exit rules for stagnant positions. If price hasn’t moved significantly in your favor within 10-15 candles on your trading timeframe, consider closing the trade even if your stop hasn’t been hit. Winning trend line trades often move quickly in your direction, while losing trades tend to grind sideways. Use trailing stops to lock in profits on winning positions, and don’t be afraid to take partial profits at logical resistance or support levels along the way.
Conclusion
The forex trend line trading strategy offers a powerful framework for understanding market dynamics and timing trades with precision. When you master the art of drawing valid trend lines, recognizing high-probability setups, and managing risk effectively, you gain access to one of the most reliable trading approaches in the forex market.
Success with trend line trading comes down to patience and discipline. Wait for clear three-touch validation before trusting any line. Focus on higher timeframes for your primary analysis. Use proper risk management with stops placed beyond trend lines plus appropriate buffers. Most importantly, don’t force trades when clean trend lines aren’t available.
Remember that our research revealed a critical gap: none of the examined forex trend line trading strategy variants include explicit exit or risk management rules. This means you must develop these components yourself using the principles outlined in this guide. Your edge comes from combining solid trend line analysis with strong risk management and consistent execution.
The market will always test your patience and discipline. Trend lines will break when you least expect it. False breakouts will trigger your stops. But when you stick to your rules and trade only the highest-quality setups, the forex trend line trading strategy can provide consistent profits over time. Start with demo trading to practice these concepts, then gradually move to live trading with small position sizes as your confidence and competence grow.