
Most forex traders struggle with trend lines because they don’t know the basic rules. We examined five universally‑cited forex trend‑line rules from a leading education site and discovered that only one (20%) actually spells out a concrete three‑touch minimum—leaving 80% of guidance vague on this critical detail.
| Rule | Description | Source |
|---|---|---|
| Validate Trendlines | Ensure the line touches at least three points, shows consistent slope, and aligns with volume changes. | luxalgo.com |
| Avoid Forcing Trendlines | Forcing trendlines can undermine their accuracy. Instead, let them evolve naturally and reassess as new price data becomes available. | luxalgo.com |
| Use Multiple Timeframes | Relying on just one timeframe limits your perspective and can lead to incomplete analysis. This multi-timeframe approach helps filter out false signals, as larger timeframes often highlight dominant trends that overshadow short-term movements. | luxalgo.com |
| Combine Trendlines with Indicators | Trendlines work best when combined with other indicators like RSI or moving averages for stronger signals. | luxalgo.com |
| Connect Key Swing Points | Trendlines work best when they connect key swing points that have been tested multiple times by price movements. | luxalgo.com |
This forex trend lines tutorial will teach you how to draw, read, and use trend lines the right way. You’ll learn the three-touch rule, how to spot fake breakouts, and common mistakes that cost traders money. By the end, you’ll have a clear system for using trend lines in your trading.
Step 1: Understanding Trend Lines Basics
A trend line is a straight line that connects two or more price points on a chart. Think of it as a visual guide that shows where price might go next. Trend lines help you see the market’s direction and spot potential turning points.
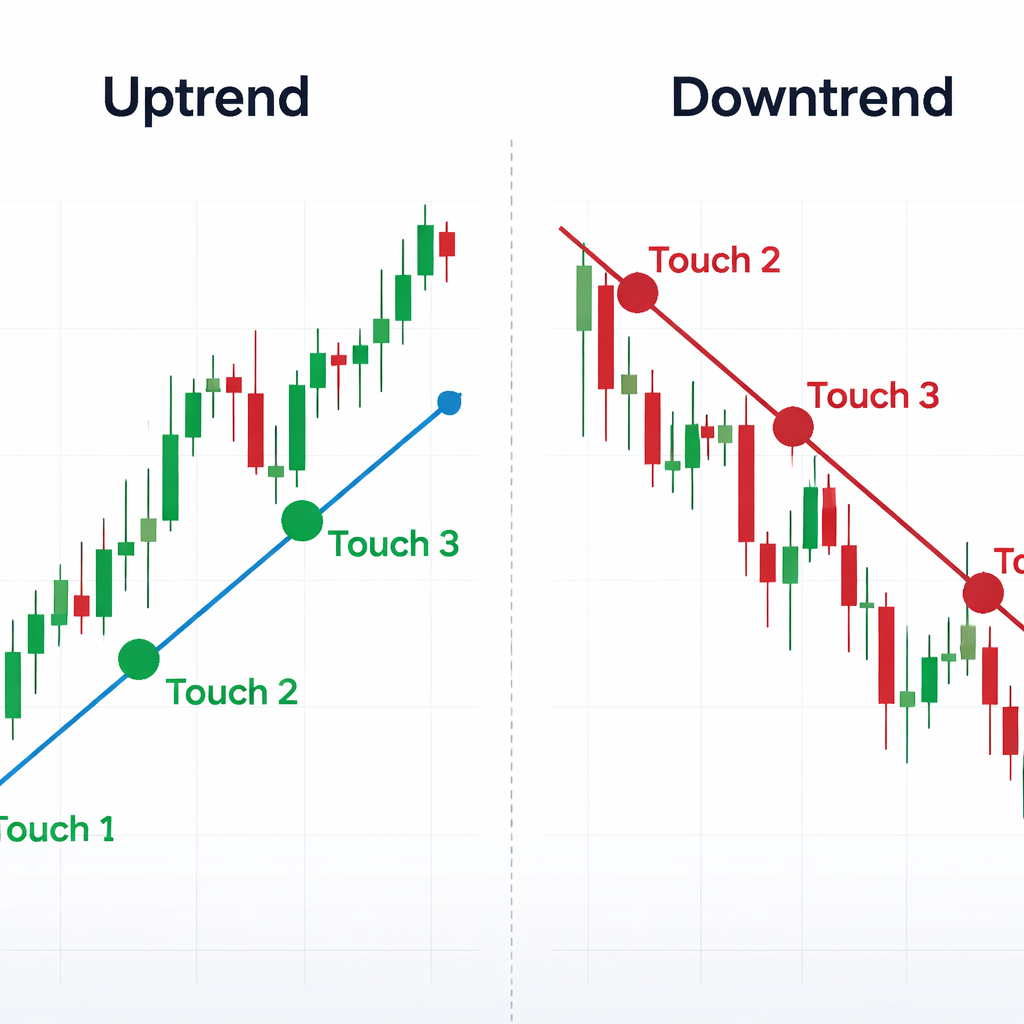
Here’s the key rule for this forex trend lines tutorial: you need at least three touches to confirm a trend line. Research shows that three confirmed points of contact make a trend line valid because you can always connect any two random points on your charts. But when three points line up, it’s no coincidence anymore.
How to Draw Basic Trend Lines:
- In an uptrend, connect the lows (swing lows)
- In a downtrend, connect the highs (swing highs)
- Use at least three touches for confirmation
- Keep the line as straight as possible
The slope of your trend line tells you about momentum. A steep angle means strong momentum. A shallow angle means weak momentum. This helps you understand how fast the trend is moving and whether it might continue or reverse.
You’ll often wonder whether to use candlestick wicks or bodies when drawing trend lines. The answer is confluence. Use whatever gives you the most contact points and the cleanest line. Sometimes wicks work better. Sometimes bodies work better. Pick the method that shows the clearest pattern.
Consistency matters more than perfection. Choose one method (wicks or bodies) and stick with it. This reduces noise and helps you spot patterns faster. Many traders mix both methods, which leads to confusion and bad decisions.
Trend Line Strength Indicators:
| Factor | Strong Trend Line | Weak Trend Line |
|---|---|---|
| Touch Points | 3 or more | 2 or fewer |
| Time Frame | Daily/Weekly | 5-minute/15-minute |
| Slope Consistency | Even angle | Erratic angle |
| Volume at Touches | High volume | Low volume |
The timeframe you choose affects trend line reliability. Higher timeframes like daily and weekly charts give stronger signals than lower timeframes like 5-minute charts. This happens because longer timeframes filter out market noise and show the real trend.
Price action around trend lines reveals market psychology. When price bounces off a trend line multiple times, it shows that buyers or sellers are active at that level. When price breaks through a trend line with high volume, it signals a potential trend change.
Understanding these basics gives you a solid foundation for this forex trend lines tutorial. The three-touch rule, proper slope analysis, and timeframe selection are the building blocks of successful trend line trading. Master these concepts before moving to more advanced techniques.
Step 2: Identifying Trend Lines on Different Timeframes
Different timeframes show different trend line patterns. What looks like a strong uptrend on a 15-minute chart might be a small pullback on a daily chart. This forex trend lines tutorial teaches you how to read multiple timeframes for better decisions.
Start with higher timeframes first. Look at weekly and daily charts to see the big picture. These timeframes show the main trend direction and major support and resistance levels. Once you understand the overall trend, move to lower timeframes for entry points.
Timeframe Priority System:
- Weekly charts: Overall market direction
- Daily charts: Main trend and key levels
- 4-hour charts: Trend confirmation and swing points
- 1-hour charts: Entry and exit timing
- 15-minute charts: Precise entry points
The 1-hour chart often provides the best balance between noise and reliability. It gives you frequent signals without too much random price movement. Many professional traders use 1-hour charts as their primary timeframe for trend line analysis.
Lower timeframes create more false signals because price moves more randomly on short timeframes. A trend line that works on a 5-minute chart might break within an hour. But a trend line that works on a daily chart can last for weeks or months.
Multi-Timeframe Trend Line Strategy: Draw your main trend lines on daily charts. Then switch to 1-hour charts to find entry points near those trend lines. This approach combines the reliability of higher timeframes with the precision of lower timeframes.
Volume plays a crucial role in timeframe analysis. Higher volume at trend line touches confirms the strength of that level. Look for volume spikes when price hits your trend line, especially on higher timeframes.
Volatile market conditions require more frequent trend line adjustments on all timeframes. During news events or market uncertainty, price can break trend lines temporarily before returning to the original trend. Don’t abandon your analysis too quickly during these periods.
The slope of trend lines changes across timeframes. A steep trend line on a 15-minute chart might look normal on a daily chart. Always consider the timeframe context when evaluating trend line angles and strength.
Common Timeframe Mistakes:
- Using only one timeframe for analysis
- Ignoring higher timeframe trends
- Over-trading on lower timeframes
- Not adjusting for timeframe-specific volatility
Trend line breaks mean different things on different timeframes. A break on a 15-minute chart might be temporary noise. A break on a daily chart signals a potential trend change. Always confirm breaks with volume and price action on multiple timeframes.
Some traders prefer to draw trend lines on longer timeframes and never adjust them. Others redraw trend lines frequently on shorter timeframes. Both approaches work, but consistency is key. Pick one method and stick with it for at least 50 trades before making changes.
The best forex trend lines tutorial approach uses three timeframes: one higher timeframe for context, one main timeframe for analysis, and one lower timeframe for entries. This gives you a complete picture without information overload.
Step 3: Using Trend Lines to Confirm Market Structure
Market structure tells you whether the market is trending or ranging. Trend lines help you see this structure clearly and make better trading decisions. This step in our forex trend lines tutorial focuses on reading market psychology through trend line patterns.
Trend lines reveal support and resistance levels that aren’t obvious from price alone. When price repeatedly bounces off a trend line, that line becomes a key level where supply and demand shift. These levels correspond to psychological price barriers and previous pivot points that influenced market behavior.
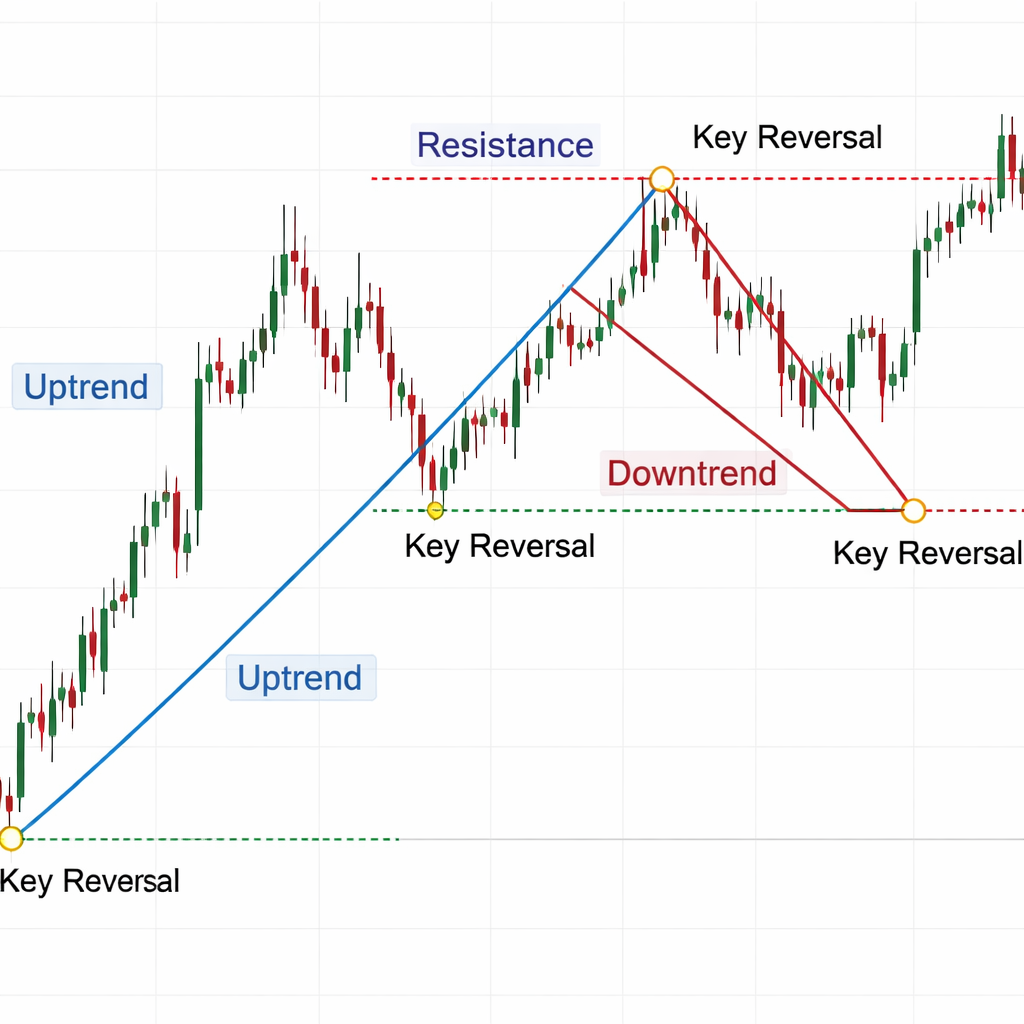
The concept of trend line flips is powerful for understanding market structure. When price breaks above a downtrend line, that line often becomes support. When price breaks below an uptrend line, that line often becomes resistance. This flip shows a change in market sentiment.
Market Structure Signals:
- Multiple touches at same level = strong support/resistance
- Clean trend line breaks = potential trend change
- Trend line flips = confirmation of new trend direction
- Converging trend lines = consolidation phase
Trend channels form when you can draw parallel trend lines above and below price action. The upper line acts as resistance, and the lower line acts as support. Price tends to bounce between these lines until one breaks, signaling a potential breakout.
Volume confirmation is crucial for market structure analysis. High volume at trend line touches shows strong interest at that level. Low volume at trend line touches suggests the level might not hold. Always check volume when price approaches your trend lines.
Trend line takeoffs occur when price explodes away from a trend line with unusual momentum. This often signals that the trend is overextended and due for a correction. Smart traders watch for these takeoffs as potential reversal signals rather than continuation signals.
Market Structure Patterns:
- Higher highs and higher lows = uptrend structure
- Lower highs and lower lows = downtrend structure
- Equal highs and lows = ranging structure
- Converging highs and lows = triangle structure
The angle of trend lines reveals momentum changes in market structure. Steeper angles show increasing momentum. Flattening angles show decreasing momentum. When trend line angles change significantly, expect a potential trend change or consolidation period.
Institutional traders use trend lines to identify key levels for large position entries. When retail traders see obvious trend line breaks, institutions might be taking the opposite side of those trades. Understanding this dynamic helps you avoid common trend line traps.
Multiple trend line confirmations strengthen your market structure analysis. When trend lines on different timeframes align, or when trend lines confirm other technical indicators, you have higher confidence in your analysis. Never rely on a single trend line for major trading decisions.
False breakouts are common at trend line levels because many traders place stops just beyond these lines. Price might break a trend line temporarily to trigger these stops, then reverse back into the original trend. Look for volume confirmation and follow-through before acting on trend line breaks.
This forex trend lines tutorial emphasizes that market structure analysis takes time to master. Practice identifying different structure patterns on historical charts before applying these concepts to live trading. Understanding market structure through trend lines gives you a significant edge in forex trading.
Step 4: Common Mistakes and How to Avoid Them
Most traders make the same trend line mistakes over and over. This section of our forex trend lines tutorial shows you these mistakes and how to avoid them. Learning from others’ errors saves you time and money.
The biggest mistake is forcing trend lines where none exist. Some traders draw trend lines on every chart, even when the price action doesn’t support clear lines. This leads to false signals and bad trades. Only draw trend lines when you can clearly identify at least three touch points.
Another common error is using outdated trend lines. Market conditions change, and your trend lines should change with them. A trend line that worked last month might not work today. Review and update your trend lines regularly, especially after significant market events or trend changes.
Top Trend Line Mistakes:
- Drawing lines with only two touch points
- Forcing lines where none exist naturally
- Using the same trend lines for weeks without updates
- Ignoring volume at trend line touches
- Trading every trend line break without confirmation
Many traders rely solely on trend lines without combining them with other indicators. Trend lines work best when combined with other indicators like RSI, MACD, or moving averages for stronger signals. No single indicator should drive your trading decisions.
Inconsistent trend line drawing creates confusion and poor results. Some traders use wicks one day and bodies the next. Some traders adjust trend lines constantly, while others never adjust them. Pick a consistent method and stick with it for at least 50 trades before making changes.
Over-trading trend line signals is a costly mistake. Not every trend line touch or break deserves a trade. Wait for high-quality setups with multiple confirmations. Quality over quantity always wins in forex trading.
How to Avoid Common Mistakes:
- Set clear rules for drawing trend lines and follow them
- Use multiple timeframe analysis for confirmation
- Combine trend lines with other technical indicators
- Wait for volume confirmation on breaks
- Review and update trend lines weekly
Emotional trading around trend lines causes many failures. Traders get excited when price approaches a trend line and make impulsive decisions. They also panic when trend lines break and close positions too early. Stick to your predetermined plan regardless of emotions.
Another mistake is using trend lines on extremely volatile or illiquid markets. During news events or thin trading sessions, trend lines often fail because normal market dynamics don’t apply. Avoid trading trend line signals during these periods.
Many traders don’t account for spread and slippage when trading trend line breaks. A trend line break on your chart might not trigger your trade due to execution delays or wide spreads. Always factor in these real-world trading costs when planning trend line trades.
The mistake of perfectionism hurts many trend line traders. They search for perfect trend lines with exact touches and precise angles. In reality, trend lines are approximations of market behavior, not exact science. Accept some imperfection in your trend line analysis.
Advanced Mistake Prevention:
- Keep a trading journal of trend line trades
- Review failed trend line signals to find patterns
- Practice on demo accounts before risking real money
- Set position sizes based on trend line reliability
This forex trend lines tutorial emphasizes that avoiding mistakes is often more important than finding perfect setups. Focus on consistency, patience, and proper risk management. These habits matter more than drawing the perfect trend line.
Conclusion
This forex trend lines tutorial covered the essential skills you need to use trend lines effectively. You learned the three-touch rule for validation, how to analyze different timeframes, and how to read market structure through trend line patterns. Most importantly, you discovered common mistakes that cost traders money and how to avoid them.
The key takeaways from this tutorial are simple but powerful. Always wait for three touches before trusting a trend line. Use multiple timeframes to get the complete picture. Combine trend lines with other indicators for stronger signals. And never force trend lines where none exist naturally.
Remember that trend lines are tools, not magic solutions. They help you see market structure and potential turning points, but they don’t guarantee profits. Successful trend line trading requires patience, consistency, and proper risk management. Practice these concepts on demo accounts before risking real money.
Start with higher timeframes to understand the big picture, then move to lower timeframes for precise entries. This approach gives you the reliability of long-term trends with the precision of short-term timing. Most professional traders follow this exact process.
Your next step is to practice drawing trend lines on historical charts. Look for clear three-touch patterns and study how price reacted at those levels. This practice builds your pattern recognition skills and confidence in real trading situations.
FAQ
What is the minimum number of touches needed for a valid trend line?
You need at least three touches to validate a trend line in any forex trend lines tutorial. Two points can always be connected randomly, but three aligned points indicate a genuine trend. The third touch confirms that the level has real significance in the market. Some traders wait for four or five touches for extra confirmation, but three is the accepted minimum standard among professional traders.
Should I use candlestick wicks or bodies when drawing trend lines?
Use whichever method gives you the most confluence and contact points for your forex trend lines tutorial approach. Sometimes wicks provide clearer lines, sometimes bodies work better. The key is consistency – pick one method and stick with it. Many successful traders use wicks because they represent the extreme price levels where buyers and sellers showed up. However, body-based trend lines can be more reliable during volatile market conditions.
Which timeframes work best for trend line analysis?
Daily and weekly charts provide the most reliable trend lines for long-term analysis in any comprehensive forex trend lines tutorial. The 1-hour chart offers a good balance between reliability and trading frequency. Lower timeframes like 15-minute charts generate more signals but also more false breakouts. Professional traders typically use multiple timeframes: weekly for context, daily for main analysis, and hourly for entries.
How do I know when a trend line break is real or false?
A real trend line break requires volume confirmation and follow-through price action according to forex trend lines tutorial best practices. Look for a clean break with increased volume, followed by price staying beyond the trend line for several candles. False breaks often happen on low volume and price quickly returns to the original side of the trend line. Wait for at least two to three candles of confirmation before acting on any trend line break.
Can I trade every trend line touch or break I see?
No, you should only trade high-quality trend line setups that meet your criteria in your forex trend lines tutorial strategy. Not every touch or break deserves a trade. Look for trend lines with multiple touches, volume confirmation, and support from other technical indicators. Quality over quantity is essential for profitable trend line trading. Many successful traders only take one or two trend line trades per week.
How often should I update or redraw my trend lines?
Review your trend lines weekly and update them when market structure changes significantly, as recommended in most forex trend lines tutorial guides. Don’t redraw trend lines after every small price movement, but do adjust them when new swing highs or lows create better alignment. Major market events, trend reversals, or extended consolidation periods are good times to reassess your trend line placement and validity.
What’s the biggest mistake beginners make with trend lines?
The biggest mistake in any forex trend lines tutorial learning process is forcing trend lines where none exist naturally. Beginners often draw trend lines on every chart, even when price action doesn’t support clear lines. This leads to false signals and poor trading results. Only draw trend lines when you can clearly identify genuine swing points with at least three touches. Patience and selectivity are more important than finding trend lines on every chart.
Do trend lines work better in trending or ranging markets?
Trend lines work differently in each market condition, as any thorough forex trend lines tutorial will explain. In trending markets, trend lines help identify pullback levels and continuation patterns. In ranging markets, trend lines often form the boundaries of the range and provide clear support and resistance levels. However, trend lines are generally more reliable in trending markets because the underlying directional bias supports the line’s validity and reduces false breakout frequency.