Forex traders love patterns. They think a good pattern can give an edge. But many patterns look alike. Some are more reliable than others. This article shows you how to use the most useful patterns and avoid the weak ones. You’ll get a step‑by‑step advanced forex chart patterns guide that covers basics, reversal setups, indicator confluence, multi‑timeframe work, and risk control.
We examined 22 advanced forex chart patterns from 5 sources and discovered that the pattern with the lowest reported reliability (Rectangle at 67.7%) actually provides the most detailed entry guidance, while the top‑rated pattern (Head and Shoulders at 85%) offers no extra entry nuance.
| Name | Reliability (%) | Primary Entry Signal | Best For | Source |
|---|---|---|---|---|
| Head and Shoulders | 85 | price breaks through the “neckline” created by the two swing low points in a head and shoulders | Best for highest reliability | investing.com |
| Double Bottom | 78.55 | price breaks above the swing high point created by the first low in a double bottom | Best for balanced reliability | samuraitradingacademy.com |
| Double Top | 75.01 | price breaks below the swing low point created after the first high in a double top | Best for clear breakout signal | samuraitradingacademy.com |
| Flag | 70 | break of the upper trendline in a bull flag (or the lower trendline in a bear flag) | Best for bullish flag clarity | samuraitradingacademy.com |
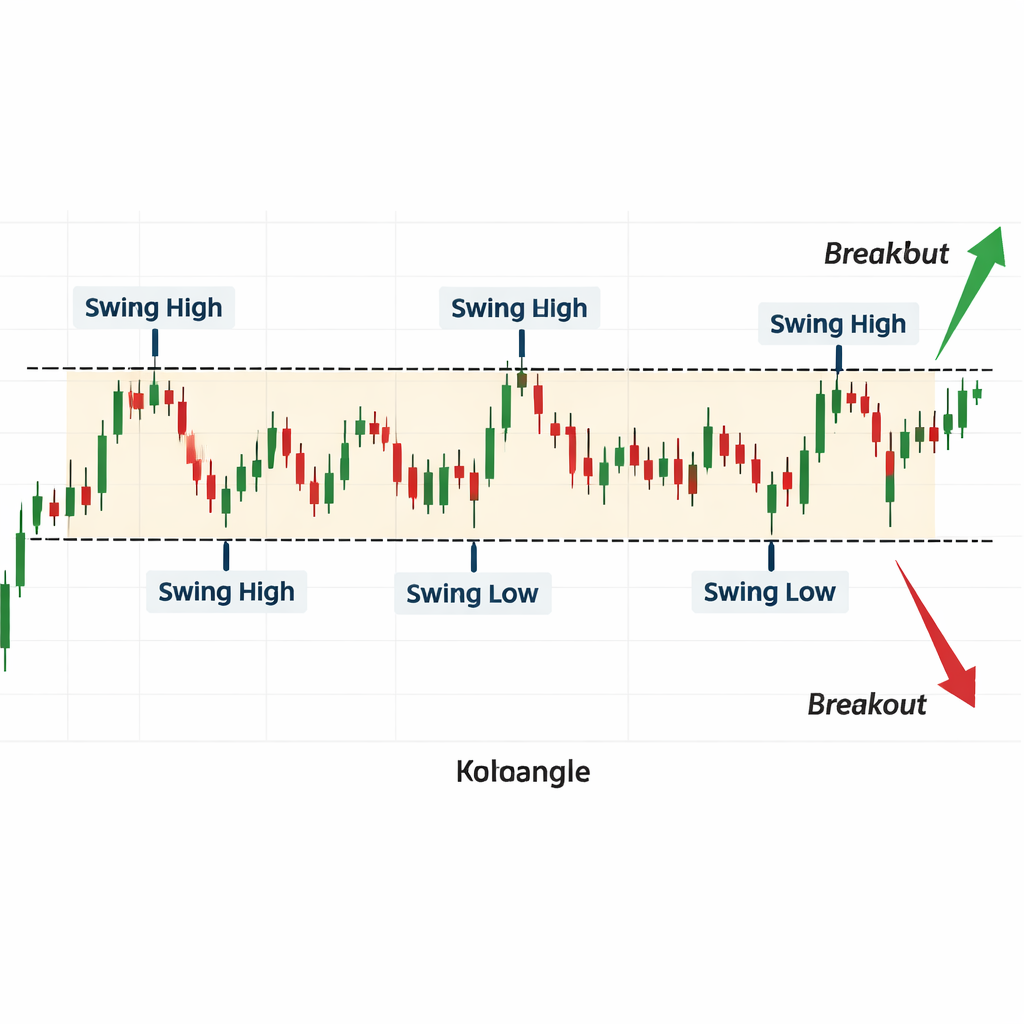
| Rectangle | 67.7 | price breaks the resistance line in a bullish rectangle, or when price breaks the support line in a bearish rectangle | Best for range‑bound patterns | investing.com |
| Shooting Star | — | Wait for the next candlestick to close below the Shooting Star’s low to validate the bearish signal | Best for cautionary insight | puprime.com |
Methodology: We searched for “advanced forex chart patterns” across major trading sites and a direct crawl of puprime.com on April 2 2026. We pulled each pattern’s name, reliability, entry signal and any noted mistake. We kept 22 items that had at least two data fields. This gives a solid base for the guide.
Step 1: Review Fundamental Chart‑Pattern Concepts
Before you chase fancy shapes, you need the basics. Patterns are just price repeats. They work because traders react the same way over and over. That is why a rectangle can tell you where price might bounce.
First, learn the four parts of a pattern: swing high, swing low, trend line and breakout point. A swing high is a peak that the market fails to break. A swing low is a trough that the market fails to dip below. Trend lines connect these points. Breakout is when price finally crosses the line.

Next, practice spotting the pattern on a demo chart. Open a 4‑hour EURUSD chart. Look for a flat price range that lasts at least 5 candles. Draw the top line and bottom line. When price finally moves past the top line, you have a bullish rectangle breakout.
And remember the rectangle is the least reliable pattern at 67.7 % according to our research. Still, it gives you two entry cues , one for a bullish break, one for a bearish break. That dual direction can help you plan both sides of a trade.
Here are three tips to boost your pattern spotting:
- Use a clean chart style , remove clutter.
- Zoom out to see the whole range before you draw lines.
- Validate the pattern with volume , higher volume on breakout adds confidence.
For a deeper dive on basic chart patterns, the Fidelity PDF explains the theory behind each shape and shows real‑world screenshots. Fidelity chart pattern guide breaks down the steps in clear language.
When you feel comfortable, check the same PDF again for a second look at the entry signal definitions. Fidelity PDF on entry cues lists the exact price action you should watch for.
Step 2: Master Advanced Reversal Patterns
Reversal patterns tell you when a trend may end. The most reliable reversal in our table is Head and Shoulders at 85 % reliability. It signals a top in a uptrend.
To spot a Head and Shoulders, look for three peaks. The middle peak (the head) must be higher than the two side peaks (the shoulders). Draw a line connecting the lows of the shoulders , that is the neckline.
When price falls below the neckline, the pattern completes. That breakout is your entry cue. The pattern does not give a second cue, which is why it ranks high on reliability but low on entry detail.
Another useful reversal is the Double Bottom. It has 78.55 % reliability and a clear entry: price breaks above the swing high created by the first low. To draw it, find two similar lows, connect the peak between them, and watch for a break above that peak.
And the Double Top works the opposite way , break below the swing low after two similar highs.
Here’s a quick step‑by‑step for a Double Bottom:
- Identify two lows that are roughly equal.
- Confirm a modest rise between them that creates a peak.
- Mark the peak as the breakout level.
- Enter when price closes above that level.
- Place a stop just below the second low.
Three actionable tips:
- Check that the two lows are within 5 % of each other.
- Use a lower‑timeframe to confirm the breakout candle.
- Combine the pattern with a momentum indicator for extra confidence.
Remember the key finding: Double Bottom and Double Top give exact swing‑point breakouts, making them very actionable despite slightly lower reliability than Head and Shoulders.
Step 3: Combine Patterns with Technical Indicators for Confluence
Patterns alone can be noisy. Adding an indicator can filter out false signals. A simple moving average (SMA) works well with most patterns.
For a Head and Shoulders, place a 20‑period SMA on the chart. If the price is below the SMA when the neckline breaks, the confluence adds weight to a bearish outlook.
And for a Double Bottom, look for the SMA to be rising. That shows the market has overall up‑trend momentum, which backs the bullish breakout.
Below the video, you’ll see a live demo of a bullish flag forming on GBPUSD. The flag’s breakout is confirmed when the price crosses the upper trendline and the RSI moves above 50.
Using the RSI (Relative Strength Index) can help you avoid entering when the market is overbought. If the RSI is above 70, wait for a pull‑back before you act.
One more tip: combine the pattern’s entry with a volume spike. Higher volume at breakout often means the move has strength.
For deeper reading on how to blend patterns with indicators, check out the FXDoctor post Forex Chart Patterns Explained: A Step‑by‑Step Guide. It walks through each indicator choice and shows real charts.
Step 4: Apply Multi‑Timeframe Analysis to Patterns
Looking at only one timeframe can mislead you. A pattern that looks perfect on a 5‑minute chart may be just a small blip on a daily chart.
Start with a higher timeframe to set the market bias. If the daily chart shows a downtrend, only take bearish patterns on lower timeframes.
Next, switch to a medium timeframe (like 4‑hour) and locate the pattern. Confirm that the pattern aligns with the higher‑timeframe bias.
Finally, zoom into a low timeframe (15‑minute) to fine‑tune entry and stop placement.
ThinkMarkets offers a guide on harmonic patterns that explains how to use Fibonacci ratios across timeframes. ThinkMarkets harmonic pattern guide shows real‑world examples of multi‑timeframe setups.
The same source notes that harmonic patterns like the Bat or Crab have completion rates of 80‑95 % when strict ratio filters are used. That reinforces the idea that a tight rule set works across timeframes.
Another useful link from ThinkMarkets talks about using trendlines and Fibonacci together. ThinkMarkets technical analysis page gives step‑by‑step screenshots.
Three practical steps for multi‑timeframe work:
- Mark the bias on the highest timeframe.
- Find the pattern on a middle timeframe that respects the bias.
- Enter on the lowest timeframe when price breaks the pattern’s signal line.
Step 5: Integrate Risk Management with Pattern Trading
Even the best pattern can lose. That’s why you need a solid risk plan.
| Aspect | What to Do | Why It Helps |
|---|---|---|
| Position Size | Risk no more than 1‑2 % of account per trade | Limits loss if pattern fails |
| Stop Placement | Put stop just beyond the pattern’s invalidation point | Stops you out if price moves against the pattern |
| Reward Target | Set target at least twice the risk distance | Ensures positive expectancy |
| Trade Log | Record entry, stop, target, and outcome | Helps you learn from each pattern |
For a Head and Shoulders, place the stop a few pips above the right shoulder. For a Double Bottom, set the stop a few pips below the second low.
And always calculate the risk‑to‑reward ratio before you enter. If the ratio is below 1:2, skip the trade.
Another tip: use a trailing stop once the trade is in profit. That lets you lock in gains while giving the pattern room to run.
Finally, stick to your plan. Discipline beats any fancy pattern.
Conclusion
We just walked through an advanced forex chart patterns guide that covers fundamentals, reversal setups, indicator confluence, multi‑timeframe checks, and risk rules. By following each step, you can spot reliable patterns, avoid weak ones, and protect your capital.
Remember the quick verdict: Head and Shoulders scores highest on reliability, but Double Bottom gives you a clear breakout cue. Use the rectangle only if you need a dual‑direction entry and accept the lower success rate.
Keep practicing on a demo account. Test each pattern, note what works for you, and refine your process. When you’re ready, move to a live account with small size and strict risk limits.
If you liked this guide, explore more forex education on the FXDoctor blog. Happy charting!
FAQ
What is the best way to start using the advanced forex chart patterns guide?
Begin by reviewing the basic pattern parts on a demo chart. Then pick one pattern, like the Double Bottom, and trade it on a low‑risk account. Follow the step‑by‑step entry, stop and target rules in the guide. Track each trade in a journal. After a few weeks, add a second pattern and compare results. The guide’s risk‑management table will help you keep loss small.
How do I know if a pattern is reliable enough to trade?
Look at the reliability numbers in the research table. Patterns above 75 % are generally strong. Also check the pattern’s entry detail , a pattern that gives both bullish and bearish cues, like the Rectangle, may be useful even if its reliability is lower. Combine this with an indicator to boost confidence.
Can I use the advanced forex chart patterns guide on any currency pair?
Yes. The guide works on major, minor and exotic pairs. Just make sure the pair’s volatility matches your risk size. For volatile pairs, widen your stop a bit and reduce position size. The multi‑timeframe steps help you see if the pattern fits the pair’s larger trend.
What indicators work best with chart patterns in this guide?
Simple moving averages, RSI and volume are all mentioned. An SMA can confirm trend direction, RSI can filter overbought or oversold conditions, and a volume spike can validate a breakout. Pair any of these with the pattern’s signal for a stronger setup.
How often should I revisit the advanced forex chart patterns guide?
Review it after each trading week. Check which patterns gave good results and which missed. Update your journal notes and tweak entry rules if needed. The guide’s risk‑management table stays the same, but you may adjust position size as your account grows.
Is multi‑timeframe analysis necessary for every pattern?
It’s most useful for larger patterns like Head and Shoulders or harmonic setups. For small daily patterns, a single timeframe can work, but checking a higher timeframe for bias adds safety. Follow the three‑step process in the guide to keep it simple.
What should I do if a pattern fails after I’ve entered?
Exit at your stop loss. The guide’s risk table sets stops just beyond the pattern’s invalidation point, so you limit loss. Then record why it failed , maybe the higher‑timeframe bias changed or volume was low. Use that note to improve future trades.
How does this guide differ from a basic chart pattern tutorial?
This guide adds reliability data, entry‑detail comparisons, indicator confluence, multi‑timeframe checks and a full risk‑management matrix. Those extra layers turn a simple pattern view into a professional trading plan.