
Most traders stare at a single chart and think they see the whole market. In reality the picture changes when you zoom out or in. This guide shows exactly how to trade forex with multiple time frame analysis, from picking the right lenses to setting stops that fit each view.
You’ll walk through five specific steps, see a deep‑dive on trendlines, learn the common traps, and finish with a quick FAQ. By the end you can build a repeatable routine that works on any pair.
Step 1: Choose Your Primary and Secondary Time Frames
Time frames are the lenses you use to read price. A higher frame tells you the market’s mood; a lower frame shows the exact entry point. Most traders start with a daily or 4‑hour chart for bias, then drop to a 1‑hour or 15‑minute chart to fine‑tune.
Ask yourself three questions: How much time can you spend each day? How volatile is the pair you trade? What profit‑to‑risk ratio feels comfortable? Your answers will point you to a pair of frames that match your lifestyle.
For example, a part‑time trader might pick the 4‑hour chart as the primary frame and the 30‑minute chart as the secondary. A full‑time scalper could use the 1‑hour chart for bias and the 5‑minute chart for entry. The key is to stay consistent long enough to learn the rhythm.
When you settle on a combo, mark the charts in your platform. Many traders use separate windows or tab groups so the two frames stay visible at all times. This visual cue stops you from slipping back to a single‑frame view.
FX Doctor explains that a disciplined three‑timeframe hierarchy is the only approach that consistently appears across reputable sources. Following that structure gives you a clear roadmap instead of guessing.
Read more about chart basics in How to Read Forex Charts: A Step‑by‑Step Guide for Beginners. It walks you through setting up multiple windows and choosing the right candle size.
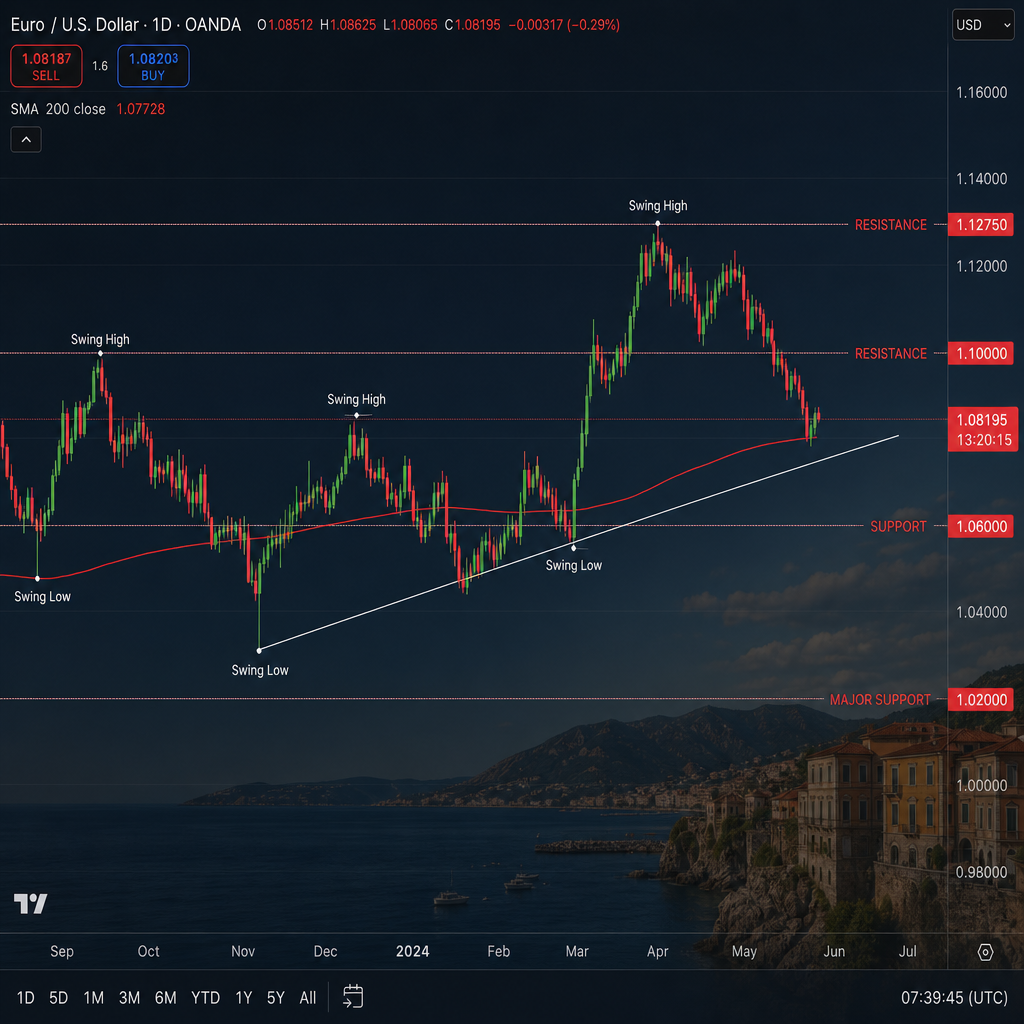
Step 2: Analyze Market Structure on the Higher Time Frame
The higher frame is where you spot the market’s overall direction. Look for clear swing highs and lows, trendlines, and major support or resistance zones. These levels act like a backbone , price tends to respect them across shorter frames.
Start by drawing the most recent swing points on the daily chart. Connect them with a straight line; if the line slopes upward, the bias is bullish. If it slopes down, the bias is bearish. A flat line suggests a range.
Next, identify the strongest horizontal levels. Use a 200‑day simple moving average as a quick trend filter , price above the MA usually signals an uptrend, below signals a downtrend. This simple rule is backed by the Federal Reserve’s research on market momentum (Fed, 2026).
Once you have the bias, note the next logical price hurdle. That could be the next swing high in an uptrend or the next swing low in a downtrend. These zones become the reference points for the lower‑frame entry.
After you finish the higher‑frame analysis, write a short note in your journal: “Bias: bullish. Key resistance at 1.2150. Key support at 1.1900.” This note keeps the higher‑frame story in mind when you zoom in later.
Step 3: Align Entry Signals on the Lower Time Frame
Switch to the lower frame now. Its job is to locate a precise entry that respects the higher‑frame zones you just marked.
First, re‑draw the same horizontal levels on the 15‑minute chart. If price is approaching the 1.1900 support you noted, watch how candles behave. Look for a bounce, a pin bar, or a small engulfing pattern that signals a reversal.
Second, add a momentum indicator that fits the lower frame. The Relative Strength Index (RSI) works well on short intervals; a bounce from oversold (below 30) can confirm the price action.
Third, check that the entry aligns with the higher‑frame bias. If the higher frame is bullish, you only take long entries near the support zone. Ignoring this rule is the most common mistake traders make, according to the research from Tradeciety.
Only when two or more of these clues line up should you consider entering. This confluence reduces the chance of being caught in a false move.
After you place the trade, keep the higher‑frame chart open. It will remind you of the bigger story and help you avoid premature exits.
Step 4: Confirm Trend with Indicator Confluence
Indicators add another layer of confidence. The goal is not to rely on one line, but to see several tools point to the same direction.
Start with moving averages. On the daily chart, a 100‑day EMA gives you the macro trend. If price sits above the EMA, the bias stays bullish.
Next, add the MACD on the 1‑hour chart. A bullish crossover (the fast line crossing above the slow line) signals that momentum is building in the same direction as the daily EMA.
Finally, bring the RSI on the 15‑minute chart. When the RSI climbs back above 50 after being in oversold territory, it confirms short‑term strength.

When all three line up , daily EMA up, hourly MACD bullish, 15‑minute RSI rising , you have a strong confluence. This matches the advice from ACY’s moving‑average strategy, which stresses that the three‑step chain (trend → bounce → entry) shifts a trade from guesswork to evidence.
Remember that indicators lag price. They are most useful when they confirm a pattern you already see on the price chart. If the price is breaking a key level but the indicators are still neutral, wait for them to catch up before committing.
Step 5: Manage Risk Using Time‑Frame Specific Stop‑Losses
Risk control is where many traders lose money. The stop‑loss you set should reflect the volatility of the frame you used for entry.
On the lower frame, measure the recent swing range. If you entered on a 15‑minute pin bar, look at the high‑low range of the last three candles. Place your stop just below the low of that range.
Then, adjust the stop to the higher‑frame level. If the daily support you used sits at 1.1900, your stop should never be tighter than a few pips above that level. This prevents you from being knocked out by normal market noise.
Use a position‑size calculator to keep your risk per trade at 1‑2 % of account equity. For example, if your account is $10,000 and you risk 1 %, your max loss is $100. Divide that by the pip distance between entry and stop to get the proper lot size.
The OANDA guide on multi‑timeframe analysis notes that aligning stops with the higher‑frame structure improves the risk‑to‑reward ratio and reduces whipsaws. Follow that practice for a smoother equity curve.
Finally, trail the stop as the trade moves in your favor. A simple method is to move the stop to break‑even once price crosses the mid‑point of the lower‑frame swing range.
Deep‑Dive: Integrating Trendlines Across Time Frames
Trendlines drawn on a daily chart often act as strong magnets. When you zoom into a 4‑hour chart, the same line can appear as a series of smaller peaks and troughs.
To integrate them, first draw the line on the higher frame. Then, copy the exact price values onto the lower chart. If the price repeatedly bounces off that line on both frames, you have a high‑confidence zone.
Use this zone as either a stop‑loss anchor or a target. For a bullish bias, a stop just below the trendline gives the trade room to breathe while still protecting capital.
Traders who ignore this cross‑frame alignment often get stopped out by minor price fluctuations that would have been harmless if the higher‑frame line had been respected.
Deep‑Dive: Common Pitfalls and How to Avoid Them
Even with a solid process, mistakes creep in. The most frequent error is starting analysis on the lower frame and then forcing a bias upward. This bottom‑up approach leads to cherry‑picking signals that conflict with the overall trend.
Another trap is over‑loading with too many timeframes. More than three frames can create noise and make decision‑making slower. Keep it simple: one higher, one lower, and optionally a middle frame for extra confirmation.
Finally, many traders set stops too tight on the lower frame, ignoring the higher‑frame support. When the market wiggles, those stops get hit and the trade never gets a chance to work. Always respect the larger structure when placing stops.
FAQ
What is multiple time frame analysis?
It is a method where you look at the same currency pair on two or more chart intervals. The higher interval shows the trend, while the lower interval gives you a precise entry point. Using both helps you avoid trading against the market’s overall direction.
How many time frames should I use?
Start with two: a higher frame (daily or 4‑hour) for bias and a lower frame (1‑hour or 15‑minute) for entry. Some traders add a middle frame (like 2‑hour) for extra confirmation, but more than three can cause analysis paralysis.
Can I use this method on all currency pairs?
Yes, but adjust the frames based on volatility. Major pairs like EUR/USD often work well with daily + hourly combos. More volatile pairs may need a higher frame of 4‑hour and a lower frame of 5‑minute to capture quick moves.
What indicators work best for multi‑timeframe analysis?
Moving averages (especially 100‑day EMA) for trend, MACD on a mid‑frame for momentum, and RSI on the entry frame for overbought/oversold conditions are a solid trio. They provide structure, momentum, and timing without clutter.
How do I set my stop‑loss correctly?
Measure the recent swing range on the lower frame and place the stop just beyond it. Then, make sure the stop is not tighter than the nearest major level on the higher frame. This two‑layer approach protects you from both noise and larger reversals.
What should I do if the higher and lower frames give opposite signals?
Trust the higher frame. A contrary signal on the lower frame usually means a false setup. Wait for the lower frame to line up with the higher‑frame bias before entering.
How often should I review my time‑frame choices?
Keep the same pair of frames for at least 30‑50 trades. This gives you enough data to see if the combo fits your style. If you notice consistent mismatches, consider switching to a different pair.
Is there a way to automate this process?
You can set up chart templates that load both frames, pre‑draw the key levels, and add your preferred indicators. Automation saves time, but always double‑check the analysis before you act.
Conclusion
Trading forex with multiple time frame analysis is not a mystery. Pick a higher frame for bias, a lower frame for entry, and use a simple set of indicators to confirm the move. Align your stops with both frames, keep a journal, and stay consistent for at least a few dozen trades. By following these steps you turn a vague hunch into a repeatable system that respects market structure.
FX Doctor offers more deep‑dive guides on chart patterns, risk management, and psychology. Keep learning, practice on a demo account, and let the multi‑timeframe routine become second nature.