
Most traders think a good trade is about picking the right entry. In reality, the secret to staying alive in the forex market is how you balance what you could lose against what you could win. That balance is called the risk‑reward ratio, and getting it right can turn a handful of wins into steady profits. In this guide you’ll learn how to understand the ratio, calculate it on a real trade, set stop‑loss and take‑profit levels, adjust it for market volatility, use tools that automate the math, and finally track the results so you can keep improving.
Step 1: Understand the Risk‑Reward Ratio
The risk‑reward ratio (often written R:R) is simply the amount you stand to lose divided by the amount you hope to gain. If you risk $100 and aim for a $200 profit, the ratio is 1:2. A lower number (like 1:3) means you’re asking for a bigger payoff for each dollar risked. The concept isn’t new , OANDA explains that the ratio helps you judge whether a trade is worth the risk according to their educational page.
Why does it matter? Because even a perfect entry can turn sour if your loss size dwarfs the potential gain. A high ratio forces you to be selective; you’ll only take trades that look strong enough to justify the risk. Conversely, a low ratio lets you trade more often but demands a higher win rate to stay profitable.
Here’s a quick way to visualise it: imagine you place ten trades, each risking $1. With a 1:2 ratio you need just three winning trades to break even (3×$2 = $6 profit, 7×$1 loss = $7 loss). With a 1:3 ratio you need only two wins (2×$3 = $6 profit, 8×$1 loss = $8 loss). The math is simple, but the discipline to stick to it is hard.
“The best trades are those where the upside far outweighs the downside.”
Bottom line:A clear, consistent risk‑reward ratio gives you a filter that keeps bad trades out before you even enter.
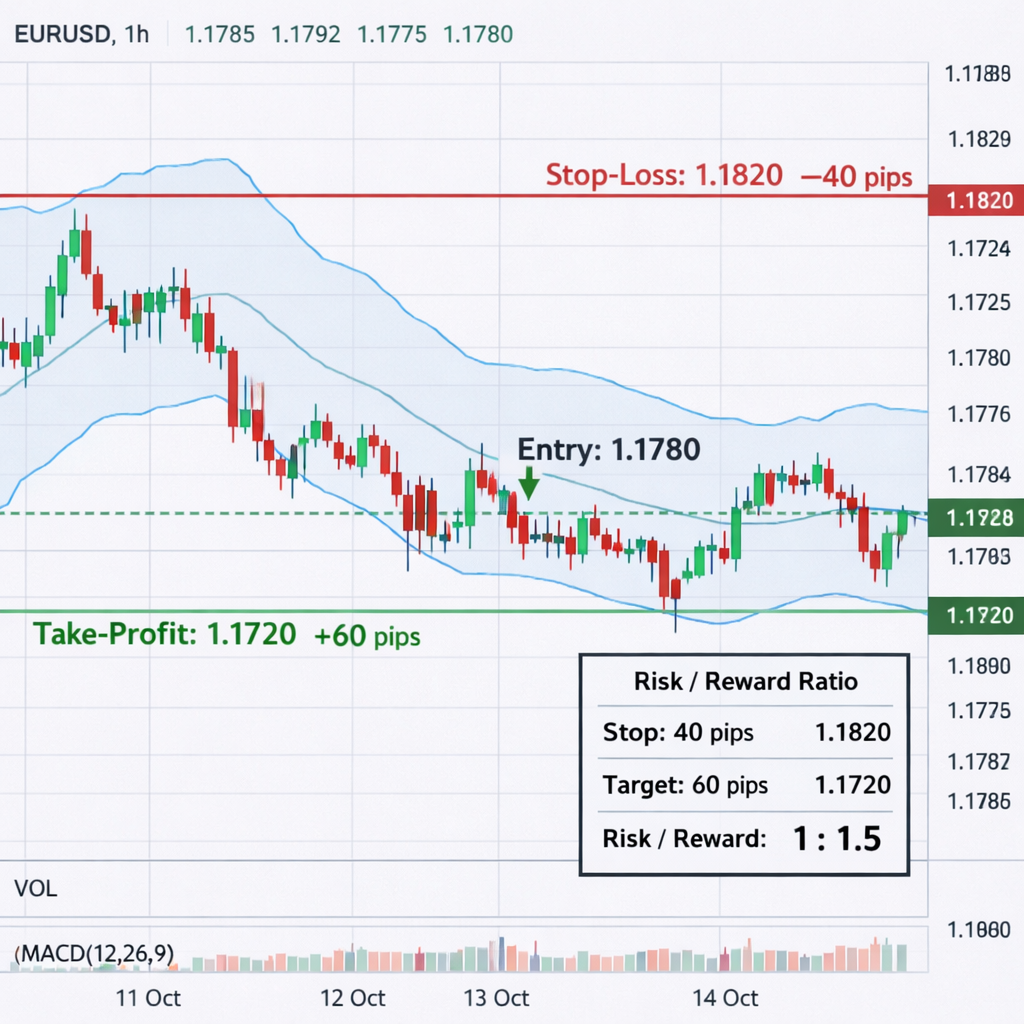
Step 2: Calculate the Ratio for a Sample Trade
Let’s walk through a concrete example on EUR/USD. Say you spot a bullish breakout at 1.1200. Your analysis tells you that a reasonable stop‑loss sits 50 pips below at 1.1150, and a realistic target is 100 pips above at 1.1300.
First, calculate the risk in pips: 1.1200 , 1.1150 = 50 pips. Next, calculate the reward: 1.1300 , 1.1200 = 100 pips. The ratio is 50/100 = 0.5, or 1:2 when expressed as a whole number.
Now plug those numbers into a risk‑reward calculator. The SmartTradingSoftware tool lets you enter entry, stop‑loss, and take‑profit prices, then instantly shows the ratio and the breakeven win rate as described on their site. For our 1:2 example, the breakeven win rate is 33% (you need to win one out of every three trades to avoid loss).
That figure matters because it lets you compare the ratio against your historical win rate. If you typically win 45% of trades, a 1:2 ratio is comfortably profitable. If your win rate is only 20%, you’ll need a higher ratio or a better entry method.
Notice the calculator also shows the exact ratio in decimal form (0.48) , that helps when you work with position‑size formulas that expect a decimal.
Bottom line:Use a simple calculator to turn price levels into a clear risk‑reward figure and an associated win‑rate threshold.
Step 3: Set Stop‑Loss and Take‑Profit Levels
Setting the stop‑loss and take‑profit is where theory meets execution. The stop‑loss should sit at a price point where your original trade idea no longer holds , often a recent swing low for longs or swing high for shorts. The take‑profit, on the other hand, should align with a logical price target such as the next resistance level, a Fibonacci extension, or a measured move.
Continuing the EUR/USD example, you might place the stop‑loss just below the breakout’s consolidation zone at 1.1150. That level respects market structure: if price falls below it, the breakout is invalid. For the take‑profit, you could aim at the next major resistance around 1.1300, which matches a 100‑pip reward.
Many platforms let you set these levels as “bracket orders” so the trade automatically exits at either point. Kraken’s documentation on bracket orders explains how to create a single order that includes both stop‑loss and take‑profit (official Kraken guide). Using bracket orders removes emotional hesitation and guarantees that your predefined ratio is enforced.
It’s also wise to consider slippage and spread. If you’re trading a pair with a 2‑pip spread, you may want to add an extra pip to the stop‑loss to avoid being stopped out on normal market noise.
Bottom line:Precise stop‑loss and take‑profit placement translates your calculated ratio into a real, enforceable trade.
Step 4: Adjust Ratio Dynamically Using Volatility
Markets aren’t static. A ratio that works in a calm range‑bound market may be too tight when volatility spikes. To keep your risk‑reward realistic, you need to let volatility guide the distance of your stop‑loss and, consequently, your target.
One popular method is to use the Average True Range (ATR) indicator. ATR measures the average size of price moves over a set period. If the 14‑day ATR on GBP/USD is 80 pips, you might set a stop‑loss at 1.5 × ATR (120 pips) to give the price room to breathe. Then scale your target proportionally , for a 1:2 ratio, aim for 240 pips.
This dynamic approach was explained on TradeWithThePros.com, which stresses that “adjusting your risk‑reward based on current market conditions helps you stay aligned with the market’s rhythm” (Trade With The Pros). The key is to recalc the ratio each time you open a new trade, rather than using a one‑size‑fits‑all stop distance.
Below is a short video that walks through using ATR to set a dynamic stop‑loss and target. Watch it, then try the steps on a demo chart.
When volatility drops, you can tighten the stop‑loss, which lets you aim for a slightly higher ratio without over‑exposing yourself. In a trending market, you might keep the stop wider but add a trailing stop to lock in gains as the price moves in your favor.
Bottom line:Adjust your stop‑loss distance with tools like ATR to keep the ratio realistic across changing market conditions.
Step 5: Apply Dynamic Ratio Selection with Tools
Manually measuring ATR and recalculating ratios can be time‑consuming. Several platforms offer built‑in calculators that handle the math for you. SwitchMarkets provides a free Risk‑Reward Ratio Calculator that takes entry, stop‑loss, and take‑profit prices, then instantly shows the ratio, required win rate, and even suggests a position size based on your capital (SwitchMarkets tool). The interface also lets you input an ATR multiplier so the stop‑loss adapts to volatility automatically.
Here’s how to use it in three steps:
- Enter the entry price for your trade.
- Set the stop‑loss distance. You can type a fixed pip value or select “ATR‑based” and choose a multiplier (e.g., 1.5 × ATR).
- Define the take‑profit level. The calculator will instantly show the resulting ratio and the breakeven win rate.
Because the calculator pulls real‑time pip values, you avoid the guesswork of estimating volatility on a chart. It also integrates with a lot of brokers, so the numbers you see match what you’ll actually trade.
Bottom line:Dedicated calculators let you apply a volatility‑adjusted ratio fast, reducing errors and emotional shortcuts.
Step 6: Track and Review Ratio Performance
Even the best plan fails if you never review the outcomes. A simple spreadsheet can capture each trade’s entry, stop‑loss, take‑profit, actual exit price, and the resulting profit or loss. From there, calculate the realized risk‑reward ratio and compare it to the target you set.
Review the table weekly. Look for patterns: are you consistently missing your targets? Is your stop‑loss getting hit more often than your take‑profit? Those clues tell you whether your ratio is too aggressive or your entry criteria need tightening.
Another useful metric is the “average actual R:R”. Divide total profit pips by total loss pips across the sample. If the average is lower than your target, you may need to raise the ratio or improve your win rate.
FXDoctor’s own risk‑management calculator (see our Forex Trading Risk Management Calculator guide) can automate this aggregation, giving you a quick snapshot of profitability.
Bottom line:Record every trade, compare actual versus target ratios, and adjust your strategy based on hard numbers, not gut feeling.
FAQ
What is a good risk‑reward ratio for a beginner?
A solid starting point is a 1:2 ratio. It means you aim to make twice as much as you risk, which requires a win rate of about 33% to break even. This level balances achievable targets with realistic stop‑loss distances, helping new traders avoid over‑using while they build confidence.
How does win rate affect the required ratio?
The breakeven win rate equals 1 ÷ (1 + R). For a 1:3 ratio, you need roughly a 25% win rate (1 ÷ (1 + 3) = 0.25). If your actual win rate is higher, you can afford a lower ratio; if it’s lower, you’ll need a higher ratio to stay profitable.
Can I use the same ratio on all currency pairs?
Not always. Pairs with tight spreads and low volatility (like EUR/CHF) may allow tighter stops, letting you keep a 1:2 ratio. More volatile pairs (like GBP/JPY) often require wider stops, pushing the ratio toward 1:3 or higher to stay realistic.
What role does position sizing play in ratio optimization?
Position size determines how much capital you actually risk on each trade. Even with a perfect ratio, risking 10% of your account per trade can ruin you quickly. Most educators recommend risking 1‑2% per trade, then scaling the lot size so the dollar risk matches your stop‑loss distance.
How often should I recalculate my risk‑reward ratio?
Recalculate every time you open a new trade. Market conditions, volatility, and price levels change, so a ratio that was 1:2 yesterday may be 1:3 today. Using a calculator that pulls live prices ensures you always work with up‑to‑date numbers.
Is a higher ratio always better?
No. A 5:1 ratio looks attractive, but it often forces you to set very distant targets that the market may never reach. That can lead to a win rate below the breakeven point, causing long‑term losses. Balance ambition with realistic price action and your personal win‑rate profile.
How can I avoid emotional bias when setting stops?
Set stops based on objective chart points, like recent swing lows or ATR multiples, before you enter the trade. Use bracket orders or platform features that lock in those levels automatically, so you don’t move them out of fear after the price moves.
Where can I find more advanced tools for ratio analysis?
Beyond basic calculators, platforms like TradingView offer scripts that plot ATR‑based stops and auto‑calculate reward zones. Many brokers also integrate risk‑reward overlays directly into their charting packages, letting you see the ratio as you draw your trade lines.
Conclusion
Optimizing your forex risk‑reward ratio is a blend of math, market awareness, and disciplined execution. Start by learning the basic definition, then practice calculating the ratio on real‑time charts. Set clear stop‑loss and take‑profit levels that honor your target ratio, and let volatility guide you when markets shift. Use dedicated calculators, like the ones from SwitchMarkets or the free tools on our site, to speed up the process and reduce errors. Finally, track every trade, compare actual outcomes to your targets, and refine your approach based on hard data.
When you treat the ratio as a living part of your trading system rather than a one‑off number, you build a framework that protects your capital and lets profits compound over time. For the next step in your education, explore our guide on forex position sizing to see how proper sizing works hand‑in‑hand with ratio optimization.
Remember, consistency beats occasional heroics. Keep your ratios realistic, your stops disciplined, and your journal honest. Over weeks and months you’ll see the difference between a plan that merely survives and one that thrives.