Backtesting can feel like a mystery, but it’s really just replaying old price moves to see if your rules hold up. Most traders skip this step and end up guessing, which leads to costly mistakes. In this guide you’ll walk through every piece of the process, from setting clear goals to polishing the final system. By the end you’ll have a repeatable method you can trust.
Step 1: Define Your Strategy Objectives
Before you click any button, write down what you expect the system to do. Ask yourself: what market will you trade? What time‑frame fits your schedule? What risk level are you comfortable with?
Clear objectives act like a map. If you know you want a 2% monthly return with no more than 10% drawdown, you can measure each test against those numbers.
Entry and exit rules must be exact. A vague rule like “buy on a bounce” can’t be coded or manually replayed without bias. Use specific criteria such as “enter when the 20‑period SMA crosses above the 50‑period SMA on the 1‑hour chart.”
Risk parameters are just as vital. Decide your stop‑loss distance, take‑profit target, and position size before you start. This prevents you from tweaking the stop after you see a loss, a habit that erodes discipline.
When you set these goals, you also decide how to measure success. Common metrics include win‑rate, profit factor, average R‑multiple, and maximum drawdown. A 40% win‑rate can still be profitable if the average win outweighs the average loss , a truth that shows up in many back‑testing checklists.
Having a written plan also helps you stay objective. You’ll be less tempted to change rules mid‑test just because a trade went against you.
Finally, note the psychological angle. Knowing you have a solid plan reduces the urge to bail when a losing streak hits.
According to Wikipedia’s overview of backtesting, the practice originated in finance to evaluate strategies without risking capital, which aligns perfectly with the educational mission of FX Doctor.
Step 2: Gather Historical Forex Data
Good data is the foundation of any reliable test. Bad data gives bad results, and you’ll waste time chasing a phantom edge.
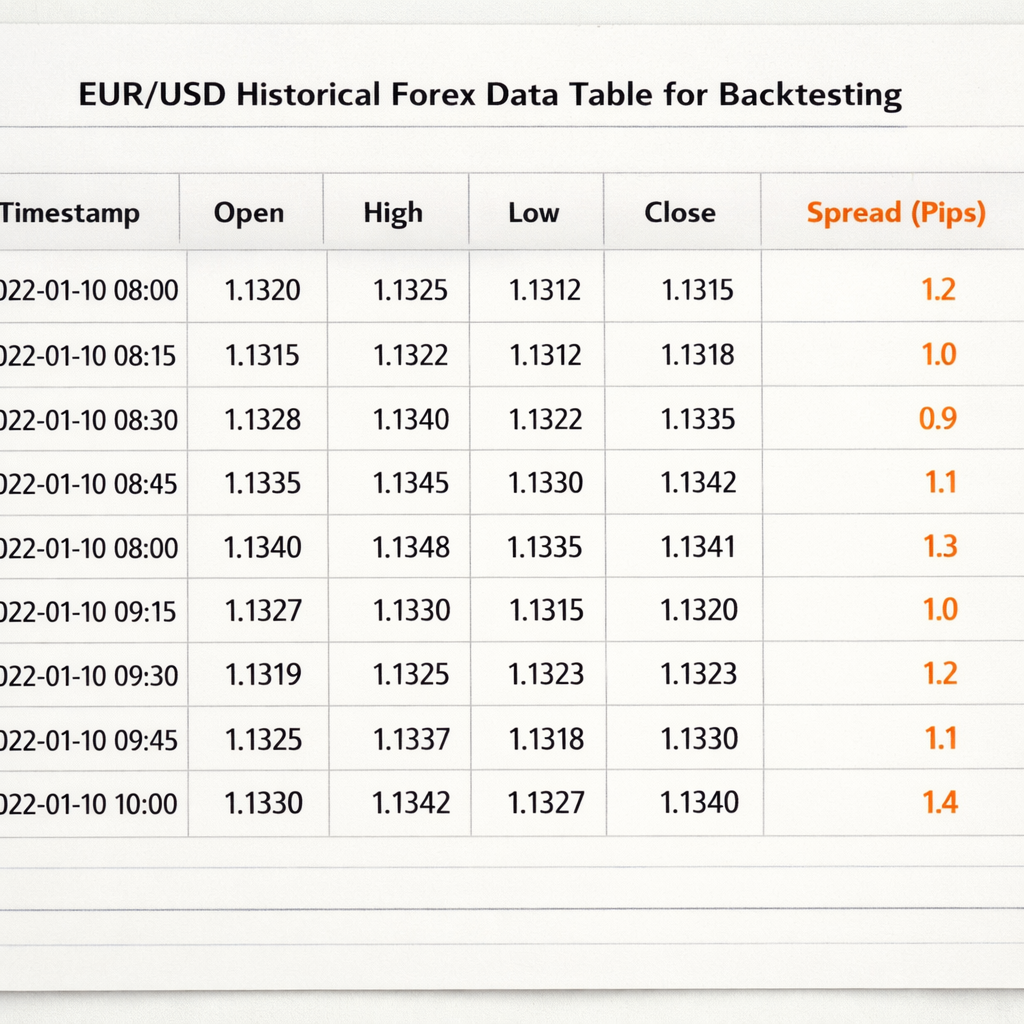
Start with a reputable source that offers tick‑by‑tick or at least minute‑level OHLC (open, high, low, close) data. Many brokers provide free CSV downloads for major pairs like EUR/USD, GBP/USD, and USD/JPY.
Make sure the dataset includes spreads and swap rates if you plan to trade overnight. Ignoring these costs can inflate your profit numbers dramatically.
Check the data for gaps. Weekend gaps, holiday closures, or missing minutes can skew results. If you spot a gap, either fill it with the previous close or discard that period from the test.
For a deeper look at how spreads affect outcomes, see the Wikipedia article on the foreign exchange market, which explains typical spread ranges for major pairs.
Store the data in a folder that mirrors your backtesting platform’s file structure. This makes it easy to load the same file across multiple tools.
When you download data, verify the timestamp zone. Most platforms use UTC, but some brokers tag data in local time, which can shift candle boundaries.
Once you have clean data, back up the file. You’ll want the exact same series when you move from manual to automated testing.

Step 3: Choose a Backtesting Platform
There are many ways to replay history, but not all platforms treat data the same. Your choice depends on the level of automation you need and how deep you want to look at stats.
MetaTrader 4 and 5 ship with built‑in strategy testers that can run both code‑based Expert Advisors and manual replay. They’re free, widely supported, and integrate directly with most brokers.
For visual learners, TradingView’s Bar Replay lets you scroll candle by candle while you log trades on paper. It’s great for discretionary strategies that rely on price‑action patterns.
If you prefer a desktop app that mimics a real broker’s execution engine, consider Forex Tester. It offers realistic slippage, spread models, and a fast‑forward mode that still respects bar‑by‑bar integrity.
When picking a tool, ask yourself:
- Does it support the timeframe you need?
- Can it import the data format you gathered?
- Does it let you add custom metrics like profit factor?
- Is there a community or documentation to help you troubleshoot?
FX Doctor’s own guide on building a personal system walks through the pros and cons of each platform in depth.
Developing a Personal Forex Trading System: Step‑By‑Step Guide for 2026 explains how to match a platform to your strategy style.
“A tool that forces you to scroll one bar at a time helps avoid hindsight bias.”
Once you’ve installed the software, do a quick sanity check: load a known dataset and run a simple moving‑average crossover. If the results look plausible, you’re ready for the real test.
Step 4: Set Up the Test Parameters (Video)
Now that you have a platform, it’s time to configure the exact rules you wrote in Step 1. This includes entry triggers, stop‑loss levels, take‑profit targets, and any filters like time‑of‑day.
Enter your parameters as code or as manual inputs, depending on the tool. For example, in MetaTrader you would write an Expert Advisor that checks the 20‑SMA crossing the 50‑SMA and then sets a stop‑loss 30 pips away.
Make sure you also set the risk per trade. If you risk 1% of a $10,000 account per trade, that’s a $100 stop‑loss. This value should be consistent across all test runs.
Before you hit “Start,” double‑check that the data range covers at least 200‑300 trades. Research shows that a sample size of 200‑300 trades gives statistical significance for most forex systems.
Watch the video above for a live walk‑through of setting up a simple SMA crossover in TradingView.
After you launch the test, let it run its full course. Avoid the temptation to stop early because the first few trades look bad , the whole picture matters.
When the run finishes, export the trade log. Most platforms let you save a CSV with columns for entry time, exit time, entry price, exit price, profit/loss, and equity after each trade.
For those who like to calculate position size on the fly, the lot‑size calculator can be a handy side‑tool.
Forex Lot Size Calculator: How to Use It Right shows step‑by‑step how to match risk, use, and stop distance.
Step 5: Run the Backtest and Analyze Results
With parameters set, press “Run” and let the engine replay each candle. The software will log every trade according to the rules you defined.
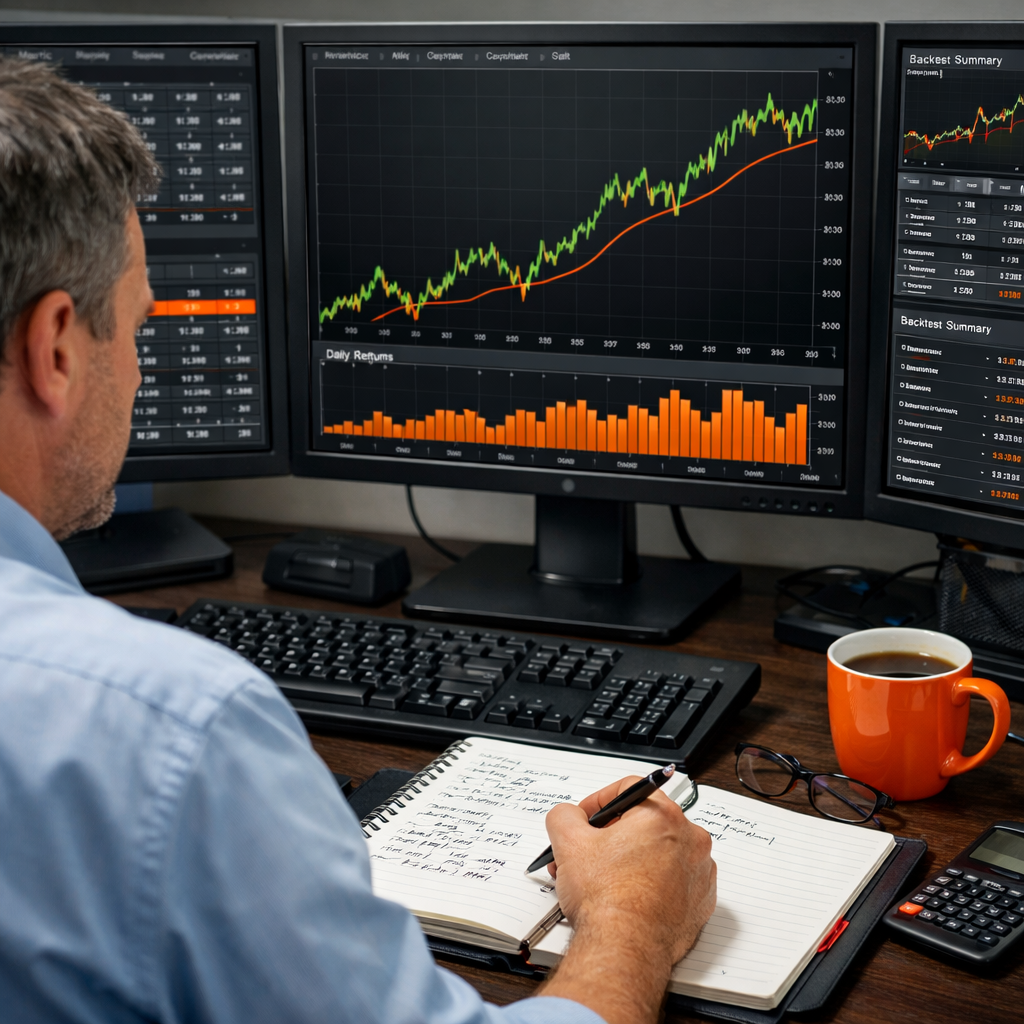
When the test ends, focus first on the equity curve. A smooth upward line with small, brief dips usually signals a strong system. A jagged curve with deep valleys may point to over‑fitting or poor risk control.
Next, calculate key metrics:
- Win‑rate: proportion of winning trades.
- Average R‑multiple: average profit divided by average loss.
- Profit factor: gross profit divided by gross loss.
- Maximum drawdown: biggest peak‑to‑trough loss.
Remember the 40% win‑rate paradox: if your average winning trade is 3 R and your average loss is 1 R, you can still be profitable.
If the profit factor is below 1.2, the system is likely losing money after costs. If drawdown exceeds 20% of account equity, you may need tighter stops or smaller position sizes.
Another useful view is the trade‑by‑trade log. Look for clusters of losing trades that line up with certain market conditions , perhaps news releases or low‑liquidity sessions.
For a broader perspective, keep a trading journal. Recording emotions, market context, and deviations from the plan helps you spot patterns that raw numbers hide.
Best Free Trading Journal Platforms 2026 lists tools that let you tag each trade with notes and export reports.
“The equity curve is a simple line, but its shape tells you whether your method is repeatable or a fluke.”
Step 6: Refine and Optimize Your System
Raw results rarely come perfect on the first try. Refinement is where you separate a good idea from a great one.
Start by adjusting one variable at a time. Change the stop‑loss distance, then re‑run the test. Record the new metrics. This isolates cause and effect, preventing the classic over‑fitting trap.
Over‑fitting happens when you tweak a strategy until it matches every historic quirk. According to Wikipedia’s definition of overfitting, such models perform poorly on new data because they captured noise, not signal.
To guard against it, split your data into two periods: in‑sample (used for tweaking) and out‑of‑sample (used for final validation). Only accept changes that improve performance in both sets.
Another refinement angle is adding a time‑of‑day filter. Many strategies work better during the London or New York sessions when liquidity is high. Test the same rules only during those windows and compare results.
When you feel the system is stable, move to forward testing. Run the strategy on a demo account in real time for at least 30 days. This checks if execution delays, slippage, or broker specifics change outcomes.
If the demo run mirrors the backtest, you’re ready to go live with a small position size. Keep the risk per trade low , 0.5% to 1% , until you gain confidence.
FAQ
What is backtesting and why is it important?
Backtesting means applying a set of trading rules to past market data to see how they would have performed. It helps you measure consistency, estimate risk, and avoid emotional decisions. By testing before you trade live, you get a realistic view of win‑rate, drawdown, and profit factor.
How much historical data should I use?
Aim for at least 200‑300 trades, which usually means several months of data for a daily‑timeframe strategy or a few weeks for an intraday system. This range gives statistical significance and captures different market regimes.
Can I backtest a strategy without coding?
Yes. Tools like TradingView’s Bar Replay let you manually scroll through candles and log trades on paper. It’s slower but gives you a deeper feel for price action and market structure.
What common mistakes should I avoid?
Watch out for over‑fitting, ignoring spreads and slippage, using too short a data set, and changing rules mid‑test. These errors create a false sense of profitability and often lead to losses when you go live.
How do I account for transaction costs?
Include realistic spread values and a modest slippage buffer (e.g., 1‑2 pips for major pairs). Most platforms let you set these parameters globally, ensuring every trade reflects true net profit.
What metrics matter most after a backtest?
Focus on profit factor, maximum drawdown, average R‑multiple, and win‑rate. A high profit factor with low drawdown indicates a strong edge, while a high win‑rate but low profit factor may signal small wins and big losses.
Should I use the same settings for live trading?
Start with the exact settings you used in the backtest, especially risk per trade and stop‑loss distances. Only adjust after you gather live performance data and confirm the model holds under real execution conditions.
How often should I re‑run my backtest?
Re‑test whenever you add a new rule, change a parameter, or notice market conditions shifting (e.g., a new central bank policy). Quarterly reviews keep your system aligned with evolving market dynamics.
Conclusion
Backtesting a forex trading system isn’t a one‑off task; it’s a disciplined loop of defining goals, gathering clean data, choosing the right tool, setting precise parameters, running the test, and then refining based on hard numbers. By following each step you build a strategy that rests on statistical evidence rather than hope.
FX Doctor teaches these practices without promises of profit, because the real win is gaining confidence in your edge. Start with a simple SMA crossover, record every trade, and let the equity curve guide your next tweaks. Over time, you’ll develop a system that respects risk, adapts to market changes, and fits your personal trading style.
Ready to put the process into action? Grab a data set, pick a platform, and run your first test today. The more you practice, the clearer the path to consistent, disciplined trading becomes.