
Most new traders think a good plan is just a wish list, but the reality is that without a clear forex trading plan example you’ll drift and lose focus.
A solid plan breaks down everything: your profit goal, how much you’ll risk on each trade, the exact entry signal, exit rule, and even when you’ll sit down to analyze. Think of it as a roadmap that tells you exactly what to do before you even open a chart.
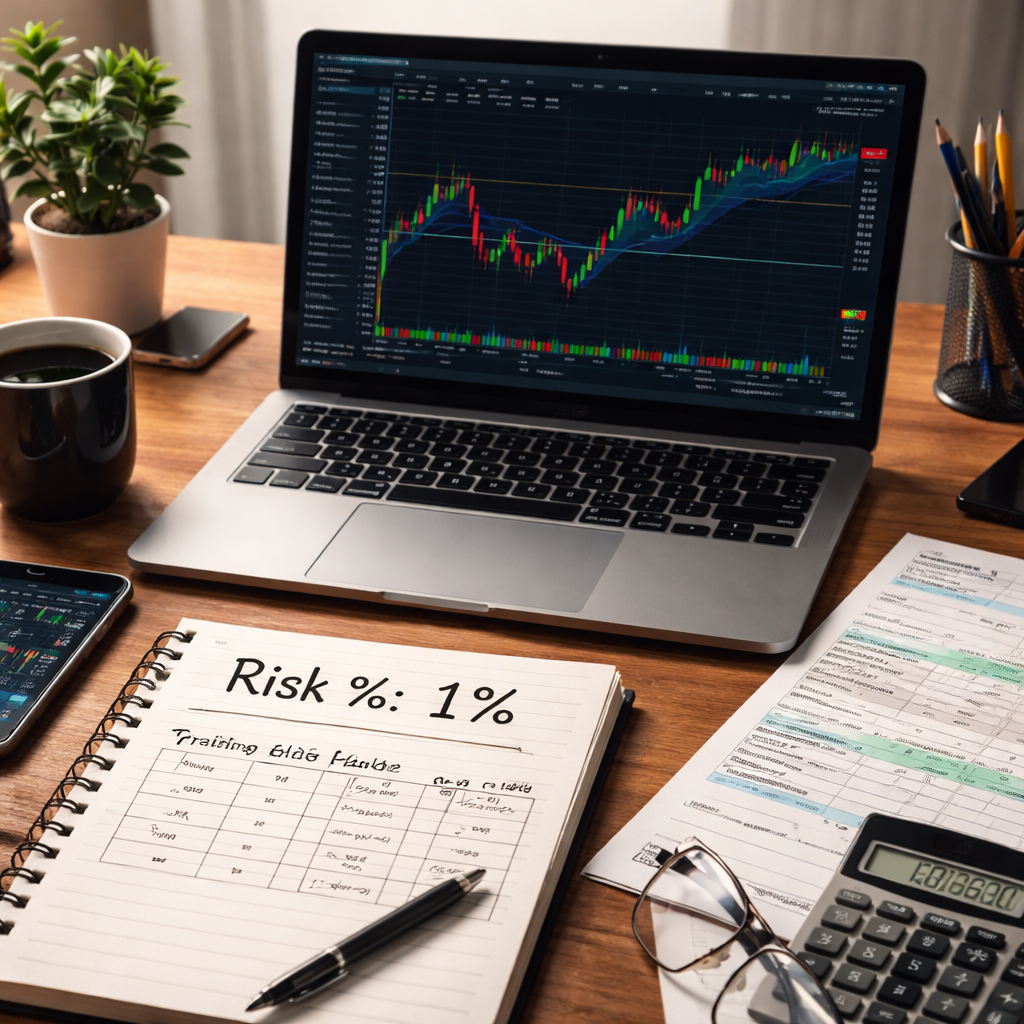
Imagine a beginner who decides to risk 1 % of the account on every EUR/USD trade, aims for a 2:1 reward-to-risk, and only trades during the London session when liquidity is high. He writes these numbers down, adds a note to check the 50-day moving average, and sets a stop loss at the nearest swing low. That simple template becomes his daily checklist.
Here’s how you can build yours in five steps: 1) define your weekly profit target; 2) set a fixed risk percentage; 3) choose one entry condition; 4) write clear exit criteria; 5) schedule dedicated analysis time.
For a ready-made structure, check out the forex trading plan template that walks you through each field. Pair it with a pomodoro timer to lock in focused work blocks and keep your plan on track.
Step 1: Define Your Trading Goals and Timeframe
First thing you need is a clear profit target. Ask yourself how much you want to earn each week or month. Write that number down in your notebook or a spreadsheet. Seeing a concrete goal stops the mind from wandering.
Next, decide how long you plan to hold a trade. Are you looking at a few minutes, a single session, or a few days? Your timeframe should match the market you trade – for example, the London session is popular for EUR/USD because liquidity spikes.
Now pair the goal with a risk limit. A common rule is to risk no more than 1 % of your account on any single trade. This keeps a string of losses from wiping you out. When you know both the reward you chase and the risk you take, the plan feels real.
It helps to break the goal into smaller steps. If your weekly target is $200, you might aim for $40 a day. That way you can check progress each evening and adjust if needed.
So far you have three building blocks: profit target, trade length, and risk cap. Put them together in a single line – something like, “I will aim for $40 profit per day, trade only during the London session, and risk 1 % per trade.” Write that sentence on a sticky note and stick it to your monitor.
Look at the note each time you log in. It reminds you why you opened the chart and keeps you from making impulsive moves.
If you ever feel the goal is too easy or too hard, tweak it. The point is to have a number you can measure, not a vague feeling.
Finally, schedule a short review at the end of each week. Write down how many days you hit the target, where you fell short, and what you’ll change. A regular check keeps the plan alive and your trading sharper.

Step 2: Choose Your Market Sessions and Instruments
Now that you’ve set a profit goal and a risk rule, the next piece of your forex trading plan example is choosing when and what to trade.
The forex market never sleeps, it moves from Sydney to Tokyo, then London, then New York, before looping back.
Each session has its own vibe. Liquidity spikes when two hubs overlap, spreads tighten, and price moves faster.
If you work a 9‑to‑5 job, the London session fits well. It opens at 3 AM EST and runs until noon, giving you active price action without midnight screens. The Forex market sessions guide details exact times.
Full‑time traders who want quick swings can add the New York open at 8 AM EST. That’s when U.S. data drops and the London‑New York overlap floods the market with volume. You’ll see the market move enough to hit a 2:1 reward‑to‑risk without chasing tiny ticks.
The Tokyo session (7 PM EST) is quieter but still lively for Yen‑crosses. It works for range‑bound setups if you prefer lower volatility. That way you avoid the noisy lunch‑hour spikes that can eat up your stop.
Pick the session(s) that fit the amount of time you can watch the chart. Write the window in your plan, e.g., “Trade EUR/USD during the London‑New York overlap, 8‑10 AM EST.”
Now pick the instruments. Major pairs like EUR/USD, GBP/USD, and USD/JPY move the most during the overlap, so they usually give the cleanest signals. These pairs also have tight spreads, which helps keep your 1 % risk rule intact.
If you like commodity‑linked pairs, try AUD/USD or NZD/USD in the Sydney or early Tokyo hours. The how to pick a forex pair guide shows how volatility and news shape each pair.
Add a short checklist to lock it in:
- Session: London‑New York overlap
- Pair: EUR/USD
- Entry cue: 50‑day MA bounce
- Stop: 1 % risk
Review the results after a week and tweak if spreads feel too wide or news too noisy.
Step 3: Build Your Technical Analysis Framework
Think of a technical framework as the engine that drives every forex trading plan example. It tells you when to step in and when to step out.
Pick a few core indicators
Don’t load every tool you see. Choose one trend indicator, one momentum gauge, and maybe a volatility measure. A moving average gives you the basic direction, the RSI flags over‑bought or over‑sold moments, and the ATR helps you size stops.
The IG forex indicators guide breaks each of these down in plain terms.
Set clear parameter rules
Write down the exact settings you will use. For example, a 50‑day simple moving average, an RSI period of 14, and an ATR multiplier of 1.5. Keep the numbers the same each day so you can compare results.
And note how the indicator behaves in the session you trade. If the 50‑day MA bounces off a swing low during the London‑New York overlap, that could be your entry cue.
Create a simple checklist
Before you open a chart, run through three quick steps:
- Is the trend indicator showing a clear bias?
- Does the momentum gauge confirm the bias?
- Does the volatility tool suggest a stop size that fits your 1 % risk rule?
If any step fails, step back. This keeps your plan from turning into guesswork.
Finally, record the outcome of each trade in a spreadsheet. Mark the indicator readings, the session, and whether the trade hit profit or stop. Review the log each week and adjust the settings if you see a pattern of false signals.
Building this framework may feel a bit like building a habit. Stick with it for a few weeks and you’ll start to see the pieces click together.
Step 4: Implement Risk Management and Position Sizing
Now that you know which indicator to watch, you need a way to keep loss small.
Most traders stick to 1 % of account equity on each trade. If your account is $5,000, that means you risk $50. Using a fixed percent stops you from blowing up when a bad string hits.
Use a volatility tool such as the ATR to decide how many pips you should give a trade room. Say the 14‑day ATR on EUR/USD reads 0.0012 (12 pips). Add a small buffer and set your stop 15 pips away.
Position size = risk amount ÷ (stop distance × pip value). For a standard lot on EUR/USD, one pip is $10. With $50 risk and a 15‑pip stop, you’d trade 0.33 lot (or 33 k). Adjust the lot size until the math fits your risk.
Write these three numbers in your trade log before you hit “enter”. That simple habit turns a vague idea into a solid rule.
Risk % per trade set (e.g., 1 %). Stop distance based on ATR or recent swing. Position size calculated to match risk.
Check the list each time you open a chart. If any item doesn’t line up, step back and wait for a better setup.
As your account grows, recalc the risk amount. A $10,000 balance means $100 at 1 % risk, which lets you take a bigger position while staying safe. Review your win loss record weekly; if you notice frequent stop outs, consider widening the stop or lowering the risk percent.
Many free online calculators let you plug in account size, risk % and stop distance to get the exact lot size. Using a tool removes mental math errors and speeds up the pre trade routine.
For a deeper dive into how traders build a risk management plan, see this risk management guide.
| Factor | How to calculate | Tip |
|---|---|---|
| Risk % per trade | Account size × chosen percent | Keep it low to survive drawdowns |
| Stop distance | ATR × multiplier (e.g., 1.5) | Adjust for market volatility |
| Position size | Risk amount ÷ (stop × pip value) | Round to nearest tradable lot |
Conclusion
You’ve walked through a full forex trading plan example, from setting goals to sizing risk.
Now you know how a simple checklist can keep emotions out of the trade. A clear profit target, a 1 % risk rule, and a repeatable entry cue give you a routine you can trust.
And when the market moves against you, the plan tells you exactly when to step back. No guesswork. No late-night panic.
So what’s the next step? Take the template you just built, write it on paper or in a spreadsheet, and test it on a demo account. Watch how the rules feel in real time.
If you stick to the plan, you’ll see steadier results and less stress. Keep refining it as you learn – the plan is a living tool, not a one-time list.
Ready to put it into practice? Start your first mock trade today and let the routine guide you.
FAQ
What is a forex trading plan example?
A forex trading plan example is a written checklist that tells you exactly what to do before, during, and after each trade. It lists your profit goal, the percent of your account you’ll risk, the time of day you’ll trade, the entry cue you’ll watch, and the exit rule you’ll follow. Having it on paper or a spreadsheet keeps emotions out of the decision.
How much risk should I put on each trade?
Most educators suggest risking no more than 1 % of your account on any single trade. If you have $5,000, that means a $50 risk. You calculate the stop-loss distance in pips, then size the lot so that a loss at that stop equals your $50 risk. This keeps one losing trade from wiping out several winners and helps your account survive a run of bad trades.
What should I include in my entry criteria?
Your entry criteria should be a single, clear signal that you can spot on the chart. For example, a bounce off a 50 day moving average while the RSI is below 30, or a break of a recent swing high with volume above the 20 day average. Write the exact indicator, the time-frame, and any price level you need to see before you press “enter”.
How often should I review my forex trading plan?
Treat your plan like a living document. At a minimum, scan it after each trading week to see if your win-loss ratio, average stop size, or profit target still feels realistic. Many traders add a monthly deep dive where they log each trade, note what worked, and tweak the entry cue or risk rule. Regular reviews keep the plan aligned with your skill level and market changes.
Can I use a template for my forex trading plan example?
Yes. A template gives you the basic fields—goal, risk %, session, entry cue, stop-loss, and profit target—so you don’t forget anything. Fill it in with numbers that match your account size and trading style, then tweak each section as you learn what works best for you. Many beginners start with a printable PDF, then move the plan to a spreadsheet for easy calculations.
What common mistake should I avoid when building a forex trading plan?
Don’t overload the plan with too many indicators or rules. Adding three moving averages, two oscillators, and a news filter can freeze you at the screen and cause analysis paralysis. Keep it simple: one trend indicator, one momentum check, and a clear stop-loss rule. Simplicity lets you act fast and stay disciplined when the market moves.