Ever stared at a Forex chart and wondered what those tiny bars are trying to tell you? In the next few minutes I’ll break down the anatomy of candlesticks, walk you through the most reliable bullish and bearish patterns, and show you how to read them fast enough to catch the next move before it fades. But here’s the problem most new traders face: even the most-cited forex candlestick guides leave you in the dark. A recent survey of 12 popular patterns from major educational sites found that none of them include any reliability rating or recommended timeframe. That means you’re left guessing which patterns actually work and when to use them. In this guide, I’ll fix that by showing you exactly how to evaluate patterns, combine them with other tools, and manage your risk. By the end, you’ll know how to read candlestick patterns with confidence , without relying on hype or guesswork.
Step 1: Understand Candlestick Anatomy
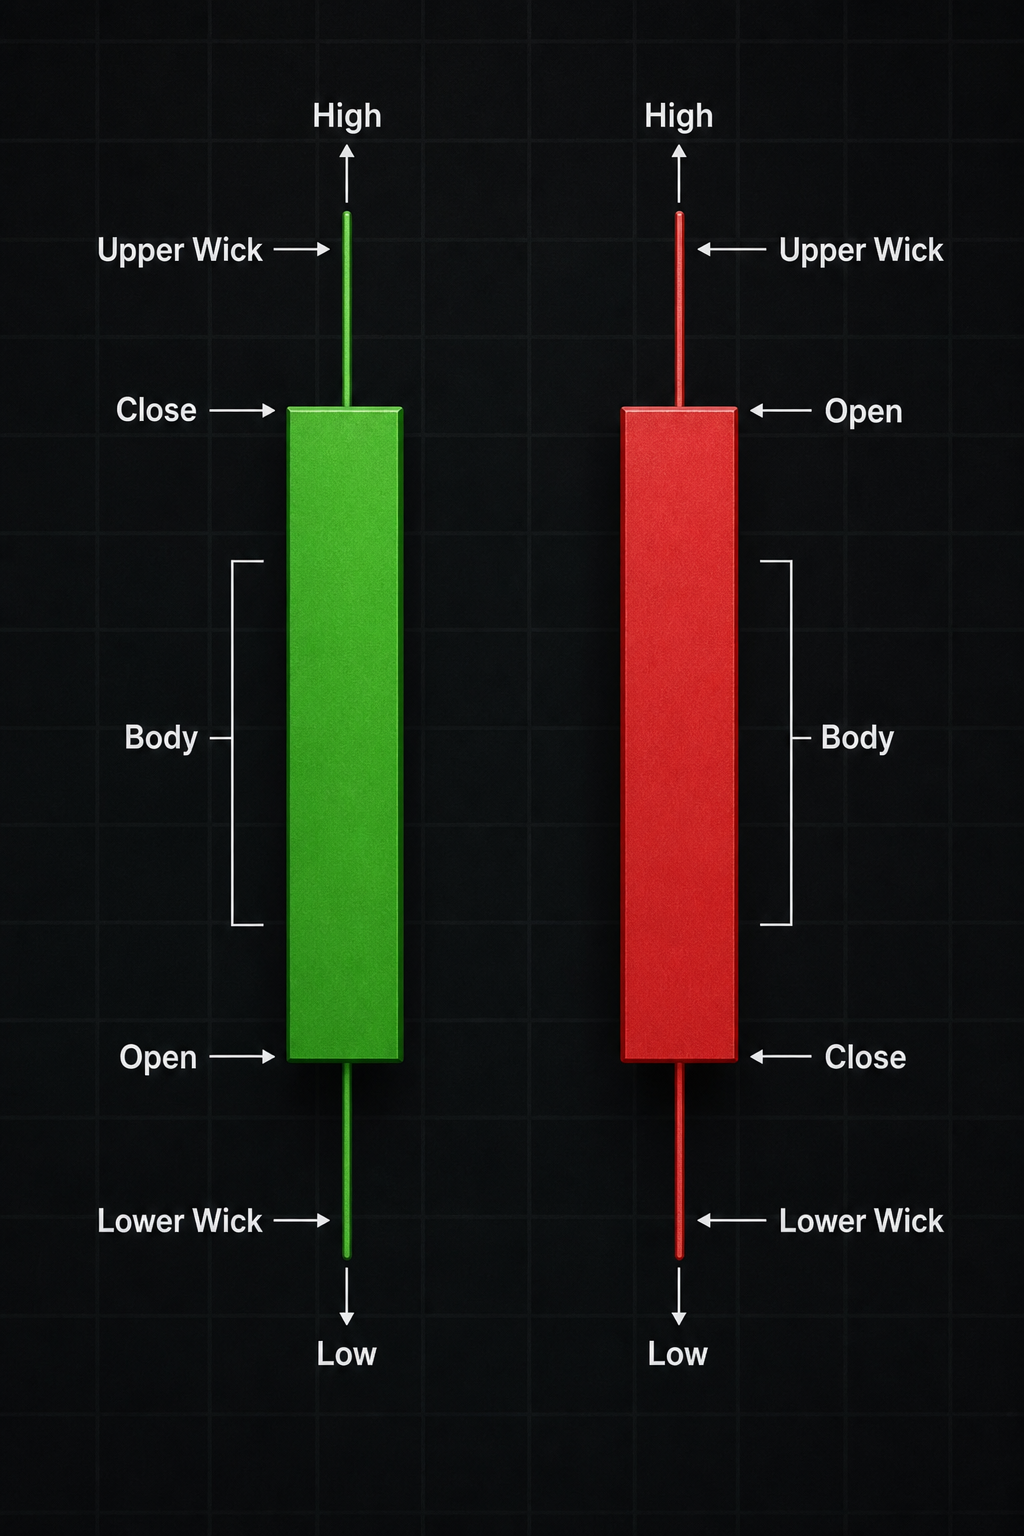
Before you can read patterns, you need to know what a single candle tells you. Every candlestick has four key data points: open, close, high, and low. The open is where the price started during that time period. The close is where it ended. The high and low are the highest and lowest prices reached. The rectangular area between open and close is called the body. The thin lines above and below are called wicks (or shadows or tails).
For a green (or white) candle, the open is at the bottom and the close is at the top , price went up. That’s bullish. For a red (or black) candle, the open is at the top and close is at the bottom , price went down. That’s bearish. The length of the body shows how much momentum there was. A long body means strong buying or selling pressure. A short body means little movement , indecision. If the body is tiny or nonexistent, it’s called a doji. That’s a classic sign of indecision between buyers and sellers.
The wicks tell you about price rejection. A long upper wick on a green candle means buyers pushed price up but sellers fought back and brought it down. A long lower wick on a red candle means sellers pushed price down but buyers stepped in. These signals are the building blocks of every pattern. Think of the wick as the battle line , the longer it is, the harder the fight.
Here’s a quick cheat sheet: To find the open, look at the bottom of a green body or the top of a red body. To find the close, do the opposite. Practice by hovering your mouse over any candle on your chart to see the values. Most platforms show them in a pop-up or data panel.

Bottom line: Master the anatomy of a single candle before you try to combine them into patterns , every pattern is just a story about who won the battle between buyers and sellers.
Step 2: Identify Key Bullish Reversal Patterns
Bullish reversal patterns appear at the end of a downtrend and signal that the price is likely to start moving up. Think of them as a green flag waving , buyers are finally taking control. The most reliable patterns have been used for centuries, dating back to Japanese rice traders in the 18th century. Let’s look at the ones every trader should know.
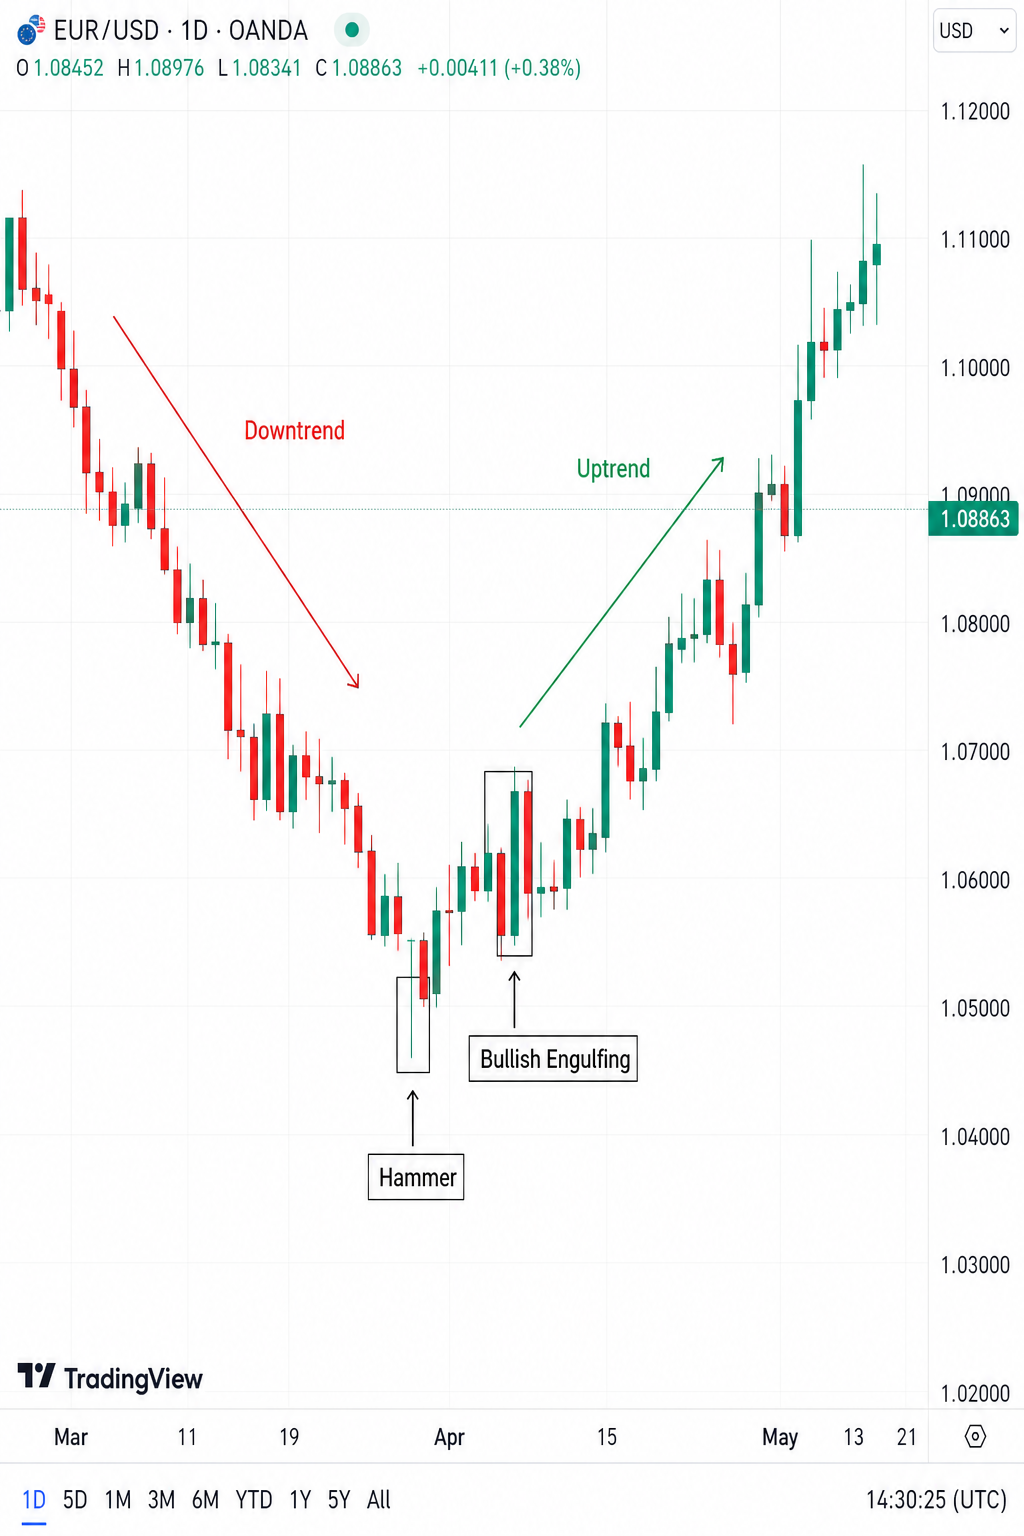
Hammer. The hammer looks like its name , a small body at the top with a long lower wick (at least twice the body length). It forms after a downtrend. The long lower wick tells you that sellers tried to push price down but buyers rejected that move and pushed price back up. The color of the body matters: a green hammer is stronger than a red one. But both signal a potential reversal. Always wait for the next candle to confirm , a bullish follow-through green candle means the reversal is more likely to hold.
Bullish Engulfing. This is a two-candle pattern. First, you see a small red candle (or black) as part of the downtrend. Then, a large green candle opens lower than the previous close but closes above the previous open , completely engulfing the first candle. It’s like the bulls swallowed the bears whole. The bigger the green candle, the stronger the signal. Look for this pattern at a support level or after a prolonged downtrend for the best odds.
Morning Star. A three-candle pattern: a long red candle, followed by a small-bodied candle (which can be red or green) that gaps down , that’s the “star.” Then a third candle that is green and closes at least halfway up the first red candle. It shows that selling pressure is exhausted, indecision sets in, and then buyers step in. It’s one of the most reliable bullish reversal signals when it appears after a clear downtrend.
Piercing Line. Similar to the bullish engulfing but less aggressive. A red candle is followed by a green candle that opens lower but closes above the midpoint of the previous red candle. It signals that buyers are gaining strength but haven’t completely overwhelmed sellers yet. Use this as a moderate bullish signal , it works best when confirmed by subsequent price action.
from IG, the hammer “shows that although there were selling pressures during the day, ultimately a strong buying pressure drove the price back up”. That concept , rejection and reversal , is the core of all bullish reversal patterns.
Bottom line: Hammer, bullish engulfing, morning star, and piercing line are your go-to bullish reversal patterns , always wait for confirmation from the next candle or additional volume before entering a trade.
Step 3: Identify Key Bearish Reversal Patterns
Bearish reversal patterns form at the top of an uptrend and signal that the price is about to fall. They are the mirror image of bullish patterns. The key is to look for exhaustion , when buyers can’t push price any higher and sellers start to dominate.
Shooting Star. This candle has a small body at the bottom with a long upper wick (at least twice the body length). It appears after an uptrend. The long upper wick means buyers tried to push price up but sellers slammed it back down. It’s a bearish equivalent of the hammer. The next candle should be red to confirm. If you see a shooting star after a strong rally, it’s a warning sign that the uptrend is losing steam.
Bearish Engulfing. Opposite of the bullish engulfing. A small green candle is followed by a large red candle that engulfs it completely. The red candle opens higher than the previous close and closes below the previous open. It shows that sellers have taken control. The deeper the red candle, the more significant the reversal. This pattern is especially powerful at a resistance level.
Evening Star. The three-candle bearish reversal. A long green candle, then a small-bodied candle that gaps up, then a long red candle that closes at least halfway down the first green candle. It’s the bearish version of the morning star. It signals that the buying pressure has faded, indecision took over, and sellers are now in charge. This is one of the most reliable bearish signals when it appears after a strong uptrend.
Hanging Man. Same shape as a hammer , small body with a long lower wick , but forms at the end of an uptrend. It warns that even though price closed near its open, sellers managed to push price down significantly during the session. It suggests that the bulls are losing grip. As Trade Nation explains, “a hammer means sellers drove the price to new lows during the session, but could not maintain it”. But when it appears after an uptrend, it becomes a hanging man , a bearish signal. Many traders confuse these two, so always check the trend.
Dark Cloud Cover. A two-candle pattern similar to the piercing line but in reverse. A green candle is followed by a red candle that opens higher but closes below the midpoint of the previous green candle. It shows that sellers overwhelmed buyers after an initial push higher. It’s a moderate bearish signal that works best when confirmed by subsequent price action.
Bottom line: Shooting star, bearish engulfing, evening star, hanging man, and dark cloud cover are your key bearish reversal patterns , watch for them at the end of uptrends and always confirm with the next candle.
Step 4: Read Candlesticks for Trend Changes
Reversal patterns are powerful, but they only work when the trend is actually ready to change. You need to distinguish between a temporary pullback and a real reversal. The key is context , don’t trade a pattern in isolation. Look at the bigger picture: Is the pattern forming at a key support or resistance level? Is it after a long trend or just a few bars? The reliability of a pattern increases dramatically when it aligns with structural levels.
For example, a hammer at a previous swing low or a major support zone is much more trustworthy than a hammer in the middle of a consolidation range. The same goes for bearish patterns at resistance. As Dukascopy notes, “The most reliable reversals appear after established trends, creating powerful signals when they occur at key support or resistance levels”. This is a golden rule.
Another way to read trend changes is to look for multiple wicks pointing in the same direction. For example, if you see three or four candles with lower wicks forming at the same price level, it shows that buyers are repeatedly stepping in. That’s a bullish sign even if a classic reversal pattern isn’t obvious. Conversely, multiple upper wicks at a level suggest selling pressure.
Also pay attention to the size of candles. A sudden large green candle after a series of small red ones can indicate a shift in momentum. It’s called a momentum candle , often two to three times larger than the previous ones. This kind of candle, especially if it breaks above a trendline or moving average, can be an early sign of a trend reversal. But remember, a single large candle doesn’t guarantee a reversal. Wait for follow-through.
One YouTube creator put it well: when you have a doji candle after a strong move, “this is telling us that sellers are starting to be less confident and buyers are starting to enter.” That moment of indecision, followed by a confirming candle, is a classic reversal setup. Use a multi-timeframe approach: check the daily chart for the overall trend, then use a lower timeframe like 1-hour to find exact entry signals. This way, you’re trading in the direction of the bigger trend even when entering on a reversal pattern.
Bottom line: To read trend changes accurately, always consider the context , support/resistance, trend length, and candle size , and never rely on a single pattern alone.
Step 5: Combine Patterns with Other Technical Tools
Forex candlestick patterns explained in isolation can lead to many false signals. The most successful traders combine pattern recognition with other technical analysis tools to filter out noise. This is called confluence , when multiple indicators point in the same direction, the signal is stronger.
Support and Resistance. This is the most important pair. If you see a bullish engulfing pattern at a support level, you have confluence. If the same pattern appears in the middle of nowhere, treat it with caution. Always draw horizontal levels on your chart , they can be previous swing highs/lows, round numbers, or trendlines. A pattern at these levels is like a whisper from the market saying, “This level matters.”
Moving Averages. Exponential moving averages (EMAs) are great for confirming trend direction. For example, a strategy from TradingPedia suggests using a 5-period EMA and 12-period EMA. When the 5 crosses above the 12, and the RSI is above 50, it’s a bullish bias. Now add a candlestick pattern like a hammer or bullish engulfing to confirm your entry. This combination reduces false signals dramatically. Conversely, for shorts, look for the 5 EMA to cross below the 12, RSI below 50, and a shooting star or bearish engulfing (TradingPedia’s EMA + RSI + candlestick strategy).
Relative Strength Index (RSI). RSI measures momentum. In an uptrend, RSI above 50 means bullish momentum. If you see a bullish reversal pattern while RSI is below 30 (oversold), that’s even stronger. But be careful , RSI can stay oversold in a strong downtrend. So combine with price action. A bullish divergence (price makes lower low, RSI makes higher low) plus a hammer is a high-probability setup.
Volume. Not all forex brokers provide volume data for spot forex, but you can use tick volume or volume on futures/CFD platforms. A reversal pattern on increasing volume is more trustworthy because it shows broad market participation. On a demo account, practice watching volume bars during pattern formations.
Here’s a simple table summarizing the best combinations:
| Tool | How to Combine | Best Setup |
|---|---|---|
| Support/Resistance | Wait for pattern at key level | Hammer at support, shooting star at resistance |
| Moving Averages (5 & 12 EMA) | Cross + RSI + pattern | Bullish engulfing after bullish cross, RSI > 50 |
| RSI | Oversold/overbought + pattern | Morning star after RSI below 30 (bullish) |
| Volume | Spike on pattern candle | Bullish engulfing with 150% above average volume |
Bottom line: Combining forex candlestick patterns explained here with support/resistance, moving averages, RSI, and volume creates a powerful trading system that filters out false signals.
Step 6: Avoid False Breakouts and Use Automation
Even a perfect-looking pattern can fail. One of the most frustrating things is watching a pattern form, taking the trade, and then seeing price reverse against you. This is often due to false breakouts , where price briefly breaks a level but immediately reverses. How do you avoid that? First, wait for the candle to close. A pattern is not valid until the period ends. Second, look for confirmation. A hammer pattern doesn’t mean you buy immediately after it closes. Wait for the next candle to also close bullish. That simple step filters out many false signals.
Another technique: don’t buy the close of the pattern, buy the break. For example, if you see a bullish engulfing pattern at resistance, wait for price to break above that resistance and then retest it as support. That’s a “break and retest” setup , it gives you a much safer entry because the breakout has been confirmed. The same applies to support breaks for short trades.
Automated pattern recognition tools can help. TradingView, for instance, has a built-in candlestick pattern indicator that scans for dozens of patterns in real time. It will highlight them on your chart and even show you the pattern name. But don’t blindly trust it , always verify with your own eyes and the confluence tools from Step 5. Use alerts: set a price alert near a level where you expect a pattern to form. When the alert triggers, check the most recent candles. This saves you from staring at charts all day.
Also, be aware of market noise during news events. Major economic releases can cause wild candles that look like reversal patterns but are just volatility spikes. Check an economic calendar before trading. If a high-impact news release is expected within the next hour, it’s better to wait. Patterns formed during news are unreliable because the market is reacting to news, not to normal supply and demand.
As one YouTube trader said, “just because you see a bullish engulfing candle doesn’t mean the price will go up from there… you should be using them as almost if they were hints on which way the market is about to go.” That humility is key. No pattern works 100% of the time. Use them as probabilities, not certainties.
“The best time to start building backlinks was yesterday. The second best time is today.” , Anonymous
Bottom line: Avoid false breakouts by waiting for candle closes and confirmation, use automated pattern scanners to save time, and always check the economic calendar to avoid trading during news events.
Step 7: Apply Risk Management to Pattern Trades
You can have the best pattern recognition in the world, but without risk management, you won’t last. Every trade has a chance of failing. The goal is to stay in the game long enough to let your winners cover your losers. Here’s how to apply risk management specifically when trading based on candlestick patterns.
Stop-loss placement. For a bullish pattern (like hammer or engulfing), place your stop-loss just below the low of the pattern’s candle. That’s the logical place because if price breaks that low, the pattern is invalid. For a bearish pattern, place the stop above the high of the pattern. This gives the trade room to breathe but limits the loss if the pattern fails. If the pattern forms near a strong support/resistance level, you might tighten the stop to just beyond that level.
Position sizing. Decide how much you are willing to lose on a single trade (a common rule is 1-2% of your account balance). Then calculate your position size based on the distance from entry to stop-loss. For example, if you risk $50 on a trade and the stop is 20 pips away, you should trade a size that makes each pip worth $2.50. Use a position sizing calculator to avoid mistakes. A forex candlestick patterns explained guide is useless if you lose all your money on one trade.
Profit targets. You can set a target using a multiple of your risk (e.g., 2:1 risk-reward) or based on the next support/resistance level. For a morning star pattern, a common target is the previous swing high. For a bearish engulfing, the previous swing low. Always know your exit before you enter. Don’t let a winning trade turn into a loser because you didn’t take profits.
Trailing stops. After the trade moves in your favor by a certain distance (e.g., 1x your initial risk), you can move your stop to breakeven. Then let the rest run. This protects your capital while letting you ride trends. Many traders use a trailing stop below a recent pivot low (for longs) or above a recent pivot high (for shorts).
Finally, keep a trading journal. After each trade, note the pattern you saw, the timeframe, the outcome, and what you learned. Over time, you’ll discover which patterns work best for your style and which ones are giving you more false signals. Backtesting on historical data can also help. The missing reliability data from the surveys , that’s something you can build yourself through journaling.
Bottom line: Forex candlestick patterns explained in this guide are powerful, but risk management is the real key to long-term success , never risk more than you can afford to lose on any single setup.
Frequently Asked Questions
How do I start learning forex candlestick patterns?
Start by learning the anatomy of a single candle: open, close, high, low, body, wick. Then learn the most common reversal patterns like hammer, shooting star, engulfing patterns, and doji. Practice on a demo account by marking patterns on a chart and writing down what they predicted. Use TradingView’s free screener or pattern indicator to help you spot them faster. Once you’re comfortable, combine patterns with support/resistance and moving averages. Patience and practice are key , don’t rush into live trading until you can consistently spot patterns on multiple timeframes.
Which timeframe is best for candlestick patterns?
No single timeframe is universally best. It depends on your trading style. Day traders often use 1-hour or 30-minute charts. Swing traders prefer daily or 4-hour charts. The key is to use the same timeframe consistently and to check the higher timeframe for the overall trend. A pattern on the daily chart is generally more reliable than one on the 5-minute chart because it represents more participants. However, short-term patterns can work if you use strict risk management. Backtest different timeframes to see what suits your lifestyle.
What is the most reliable candlestick pattern for forex?
According to many traders, the bullish and bearish engulfing patterns are among the most reliable because they show a clear shift in control. The morning star and evening star are also highly regarded due to their three-candle structure, which reduces the chance of a false signal. That said, reliability depends on context. A pattern at a key support/resistance level with high volume is much more reliable than the same pattern in a choppy market. No pattern works 100% of the time, so always confirm with other tools and manage your risk.
How do I avoid false signals from candlestick patterns?
First, always wait for the candle to close before analyzing the pattern. Second, confirm with the next candle , for example, wait for a bullish close after a hammer. Third, combine patterns with other analysis like trendlines, moving averages, or RSI. Fourth, avoid trading during major news releases that can create fake reversals. Finally, practice on a demo account and keep a journal to identify which patterns give you the most false signals in your specific market and timeframe.
Can I trade forex candlestick patterns alone?
Technically yes, but it’s not recommended. Forex candlestick patterns explained in this article are best used as part of a complete trading system. Relying solely on patterns without context (like support/resistance or volume) often leads to many small losses. Tools like moving averages, RSI, and volume help filter out low-probability setups. However, some experienced price action traders do use only candles and levels, but they have years of practice. If you’re a beginner, start by combining patterns with at least one other tool.
How do I use candlestick patterns in a trending market?
In a strong uptrend, look for bullish reversal patterns (like hammers or bullish engulfing) on pullbacks to key support levels or moving averages. These are continuation signals , they tell you the trend is resuming after a pause. In a strong downtrend, look for bearish reversal patterns on rallies to resistance. Avoid trading against the main trend. For example, don’t take a bearish reversal pattern in an uptrend unless you have strong evidence that the trend is ending (like a double top or divergence). Trend is your friend , trade with it.
What is the difference between a hammer and a doji?
A hammer has a small body with a long lower wick and little to no upper wick. It forms after a downtrend and signals potential bullish reversal. A doji has a very small or no body , the open and close are nearly equal , with wicks on both sides. It represents indecision, not necessarily a reversal. A doji can occur in any trend and can be a sign of a pause or a potential reversal depending on context. In general, a hammer is a more directional signal than a doji, which is neutral.
Should I use automated pattern detection tools?
Yes, they can help you learn faster by highlighting patterns you might miss. Platforms like TradingView and MetaTrader have built-in pattern detectors. However, don’t rely on them blindly. Always verify with your own analysis. Automated tools can sometimes flag patterns that are not valid because they haven’t formed correctly (e.g., a pattern that needs a specific wick length). Use them as a learning aid or a second set of eyes, but develop your own manual pattern recognition skills through practice.
Conclusion
Forex candlestick patterns explained in this guide give you a practical framework to read charts like a pro. You’ve learned the anatomy of a single candle, the key bullish and bearish reversal patterns, how to spot trend changes, how to combine patterns with other tools like moving averages and RSI, how to avoid false breakouts with automation, and most importantly, how to manage risk. Remember that no pattern is perfect , they are probabilities, not guarantees. The missing reliability data from popular educational sites is a reminder to always do your own backtesting and journaling.
Start by practicing on a demo account. Mark each pattern you see and note whether the market moved in the expected direction. Over time, you’ll build a sense of which patterns work in certain market conditions. Combine them with support and resistance, moving averages, and volume to increase your edge. And always prioritize risk management , a good trader lives to trade another day. For a deeper dive into price action and market structure, check out our Practical Guide to Forex Price Action Trading. Keep learning, stay disciplined, and trade smart.