
Most traders think they need a paid signal service to make money in forex. The truth is, you can build your own system with the tools you already have. This guide shows you how to trade forex without signals, step by step. You’ll learn to read price action, set up a rules‑based plan, pick the right technical tools, manage risk, and keep a journal that sharpens your edge.
Step 1: Master Price Action and Market Structure
Price action is the raw movement of the market. It shows who is winning at any moment , buyers or sellers. When you look at a clean chart, you see candles, swing highs, swing lows, and the shape of trends. Those shapes tell a story you can act on without waiting for an indicator to light up.
Start by pulling up a daily or 4‑hour chart. Scan for obvious swing points , a high where price turned down, or a low where it turned up. Draw a rectangle around each area that has been tested at least three times. Those rectangles become your high‑impact zones. The more times price respects a zone, the stronger it is.
Next, watch how price behaves when it reaches a zone. If it bounces sharply, the zone is strong support or resistance. If it breaks through, note the flip , a broken support can become new resistance, and vice‑versa. This flip is a classic sign that the market’s mindset has changed.
Patterns also matter. A head‑and‑shoulders shape warns that an uptrend may be ending. Flags and pennants suggest a brief pause before the trend continues. Spotting these patterns lets you time entries and exits with confidence.
Practice by reviewing past weeks. Write down each zone, the candle pattern, and what the market did. Over time you’ll see the same reactions repeat.
“Reading pure price action removes the lag that indicators add and gives you a real‑time view of market sentiment.”
For a deeper dive into why lag matters, see the explanation on Wikipedia’s technical analysis page. It outlines how price‑based methods differ from lagging studies.
Bottom line:Focus on clear price zones, pattern flips, and clean charts to read the market’s story without signals.
Step 2: Develop a Rules‑Based Trading Plan
A trading plan is a checklist you follow on every trade. It removes guesswork and keeps emotions out of the mix. Write down the market conditions you’ll trade, the entry criteria, stop‑loss placement, profit target, and how much of your account you’ll risk.
First, define the timeframes you’ll use. Many traders pick a higher‑timeframe trend (daily) and a lower‑timeframe entry (4‑hour). Your rule might be: trade only when the daily trend is up and the 4‑hour price breaks a bullish pattern.
Second, set entry rules. For example, enter long when price closes above the high of the previous bullish flag and the candle closes above the zone’s midpoint. Write the rule in plain language so you can test it quickly.
Third, decide your stop‑loss. A common rule is to place the stop a few pips below the nearest swing low or outside the high‑impact zone you identified in Step 1. This gives the trade room to breathe while limiting loss.
Fourth, pick a profit target. You can aim for a risk‑to‑reward ratio of 1:2 or 1:3. That means if you risk 50 pips, you look for a 100‑150 pip gain. Adjust the target if the market shows strong momentum.
Finally, write down your position‑size rule. The average of the 21 signal‑free techniques we studied uses about ten tools per strategy. That shows even simple plans rely on multiple checks. Keep it simple: risk no more than 1‑2 % of your account on any trade.
Write your plan in a document, then test it on a demo account for at least two weeks. Record every trade and note where the plan helped or hurt. Refine the wording until you can apply it without thinking.
For a solid definition of a trading plan, see Wikipedia’s trading plan entry. It breaks down the components you need.
Bottom line:Your plan should spell out when you trade, how you enter, where you stop, and how big the trade is , and you must stick to it.
Step 3: Use Technical Analysis Tools Effectively
Even without signals, a few well‑chosen tools can confirm what price action tells you. The goal is to add evidence, not to replace the price narrative.
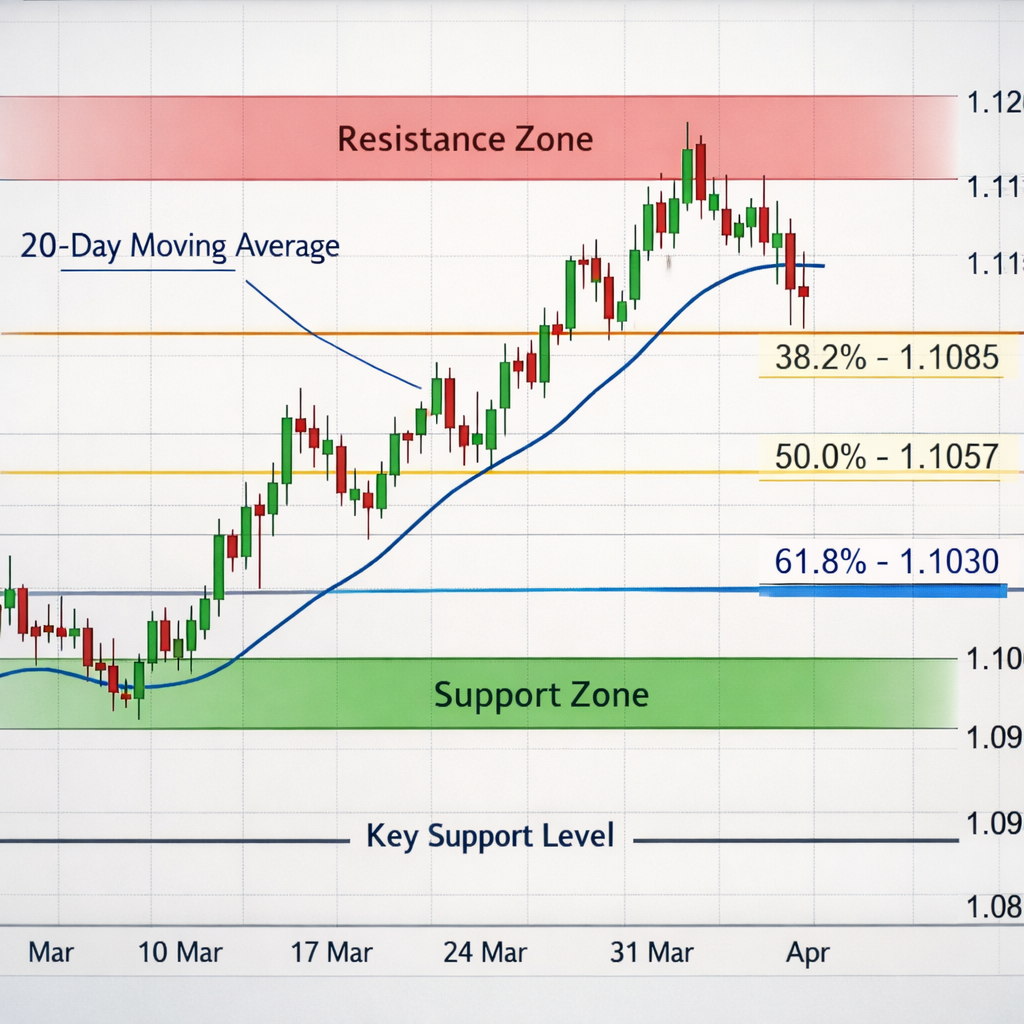
Start with moving averages. A simple 20‑period moving average on a 4‑hour chart shows short‑term trend direction. When price stays above the line, the uptrend is intact. When it dips below, watch for a possible reversal.
Next, add the Average True Range (ATR). ATR measures market volatility. Set your stop‑loss a multiple of the ATR (for example, 1.5 × ATR). This lets the stop breathe on volatile days and tightens it when the market is calm.
Support and resistance lines are still your friends. Use the zones you drew in Step 1, but you can also add Fibonacci retracements to see where price might pull back after a big move. Look for the 38.2 % or 61.8 % levels aligning with your zones , that’s a confluence point.
Finally, consider a momentum oscillator like the Relative Strength Index (RSI) only as a sanity check. If price action says the market is bullish but RSI is deep overbought, you might wait for a small pullback before entering.
Remember, each tool should confirm the same story you saw in the raw price. If they clash, trust the price.
For official definitions of these tools, refer to the Technical analysis page on Wikipedia. It covers moving averages, ATR, and Fibonacci basics.
“Indicators are only as good as the price story they back up.”
Bottom line:Use technical tools sparingly to add confidence, but let price action stay the main guide.
Step 4: Apply Proper Risk Management
Risk management is the safety net that keeps a trader alive. Even the best setups can lose. The rule is simple: never risk more than you can afford to lose on a single trade.
First, calculate your account’s risk per trade. If you have $10,000, a 1 % risk means a $100 loss max. Use the stop‑loss distance (in pips) to work out how many lots you can buy.
Second, set a daily loss limit. If you hit a 2 % drawdown in a day, stop trading. This prevents a bad day from turning into a catastrophe.
Third, diversify. Trade a few currency pairs that behave differently. If EUR/USD is choppy, you might look at USD/JPY which could be trending.
Fourth, consider position sizing formulas like the Kelly Criterion. It tells you the optimal fraction of your account to risk based on win rate and payoff ratio. For beginners, a fixed 1‑2 % rule is safer.
Regulators require brokers to disclose margin requirements. The U.S. Commodity Futures Trading Commission (CFTC) outlines these rules on its website, confirming why a disciplined risk plan matters.
Read the official guidance at CFTC margin requirements page for more details on use limits.
Bottom line:Always size your trades so a single loss can’t wipe out a large part of your account.
Step 5: Keep a Trading Journal and Review Regularly
A journal turns every trade into a learning moment. Write down the pair, entry time, price, reason for entry, stop, target, and the outcome. Also note your emotions , were you nervous, over‑confident, or bored?
Review the journal weekly. Look for patterns: do you lose more when you trade after a loss? Do certain setups give a higher win rate? This self‑audit helps you tighten the rules in your plan.Use a simple spreadsheet or a PDF template. FXDoctor offers a ready‑made journal you can download. How to Use a Forex Trading Journal PDF for Better Trade Tracking for a step‑by‑step walk‑through.
When you spot a recurring mistake, add a rule to your plan to avoid it. For example, if you often exit too early on pullbacks, create a rule that you must stay in until price breaks the next high‑impact zone.
Bottom line:Record each trade, review often, and adjust your plan based on real data.
Frequently Asked Questions
Can I really be profitable without any signals?
Yes. Profit comes from a solid edge, not from someone else’s tip. By learning price action, following a rules‑based plan, and managing risk, you can generate consistent results. Success depends on discipline and continual learning.
How much time should I spend analyzing charts each day?
Start with 30‑45 minutes a day. Review the higher‑timeframe trend, mark key zones, and check your entry criteria. As you gain experience, you’ll need less time because the patterns become familiar.
What timeframes work best for a signal‑free approach?
Many traders combine a daily chart for trend direction with a 4‑hour or 1‑hour chart for entries. This multi‑timeframe view balances big‑picture context with precise timing.
Should I use any indicators at all?
A few simple tools can add confidence. Moving averages, ATR, and Fibonacci levels are common choices. Use them only to confirm what price action already shows.
How do I decide my risk‑to‑reward ratio?
Aim for at least 1:2. If you risk 50 pips, target 100 pips. Adjust the ratio if the market is very volatile or if you have a very high‑probability setup.
What’s the biggest mistake beginners make?
Relying on external signals or overtrading. The data shows that emotional decisions and lack of risk control are the top pitfalls. Stick to your plan and keep trade size small until you’re confident.
Do I need a fancy trading platform?
No. Any platform that lets you draw zones, plot basic indicators, and record trades works. The key is consistency, not the software’s bells and whistles.
How often should I update my trading plan?
Review it after each month of live trading. If you notice a rule that never fires or causes repeated losses, tweak it. A plan should evolve with your skill.
Trading without signals puts the power back in your hands. It forces you to understand why the market moves and to build a system you trust. The steps above give you a clear path: read price action, write a solid plan, add a few confirming tools, protect your capital, and learn from every trade.
Start today by cleaning up your chart and writing the first draft of your plan. As you practice, you’ll see confidence grow and the need for external tips fade.
Ready to go signal‑free? Dive in, stay disciplined, and let the market teach you.