Forex markets move fast. If you watch only price bars, you miss the hidden battle between buyers and sellers. Order flow shows that battle in real time. In this guide you’ll learn how to use order flow in forex trading, set up the right charts, spot liquidity traps, and protect your capital.
We’ll walk through five clear steps. By the end you’ll have a practical workflow you can apply on any pair, whether you trade the London session or the New York overlap.
Step 1: Understand Order Flow Basics
Order flow is simply the stream of buy and sell orders that hit the market. When a trader sends a market order, it takes the best price that a limit order is offering. If more market orders hit the ask side, buyers are in control; if they hit the bid side, sellers dominate. This real‑time tug‑of‑war explains why price moves up or down.
Unlike classic technical analysis, which looks at past price, order flow looks at what participants are doing right now. It tells you who is aggressive, how big the aggression is, and where the market might pause.
Key components you’ll see on an order‑flow screen include:
- Order book , a list of pending limit orders at each price level.
- Time and sales (the tape) , every trade that occurs, showing size and whether it hit the bid or ask.
- Volume at price , how much has traded at each level over a chosen period.
When a large limit order sits untouched, it creates a liquidity pool. If aggressive market orders start to eat that pool, you may see an absorption pattern , a sign that a reversal could be near.
“Order flow is the most direct view of market intent. It shows you the force behind each price move.”
Because the forex market is over‑the‑counter, there is no single central order book. Most platforms show a proxy built from futures contracts or broker‑specific data. That nuance matters: the depth you see is an estimate, not a perfect ledger.
For a plain definition, see Wikipedia’s order flow entry. It explains the concept without jargon and confirms that the data reflects real‑time buying and selling pressure.
Another useful metric is Cumulative Volume Delta (CVD). It adds up net buying pressure over time; an upward‑sloping CVD line means buyers are winning the fight. When price and CVD diverge, it can signal weakening momentum.
Remember, order flow is not a magic crystal ball. It shows what is happening, not what will happen forever. Use it together with price structure, support, and resistance for the best view.
Bottom line:Grasping the basics of order flow gives you a live map of supply and demand.

Step 2: Set Up a Depth of Market (DOM) Chart
The Depth of Market, or DOM, visualizes the order book as two columns of numbers , bids on the left, asks on the right. Each number tells you how many contracts are waiting at that price.
To get a DOM, you need a broker that offers Tier 2 data. Most retail brokers give you a snapshot that updates every few seconds. Platforms like TradingView let you add a DOM panel to any chart.
Here’s a quick setup process:
- Open your chart on TradingView.
- Click the “Add Widget” button and choose “Depth of Market”.
- Select the currency pair you want to watch.
- Enable “Center on price” so the DOM follows the current market.
- Adjust the price increment (tick size) to match the pair’s pip value.
Once the DOM appears, you’ll see three zones:
- Bid side:pending buy orders below the market.
- Ask side:pending sell orders above the market.
- Mid‑price:the current market price where trades execute.
Watch how the size of the bid and ask stacks changes as price moves. A widening ask side often signals resistance, while a thickening bid side can act as support.
When you place a limit order directly from the DOM, you click the cell at the desired price. HoldingCtrlwhile clicking places a stop order instead. This fast order entry is why many scalpers love the DOM.
TradingView’s DOM documentation explains the widget in detail. See TradingView’s DOM guide for a full feature list.
Because the DOM data comes from your broker, it may differ from the “real” market depth you’d see on a futures exchange. Treat it as a high‑frequency snapshot, not an absolute ledger.
Forex Trading Tutorial: From Beginner Concepts to Advanced Techniques walks through how to link a broker account to TradingView, a useful next step after you master the DOM.
Bottom line:Setting up a DOM gives you a live view of order book depth, the foundation for order‑flow analysis.
Step 3: Identify Liquidity Pools and Imbalance
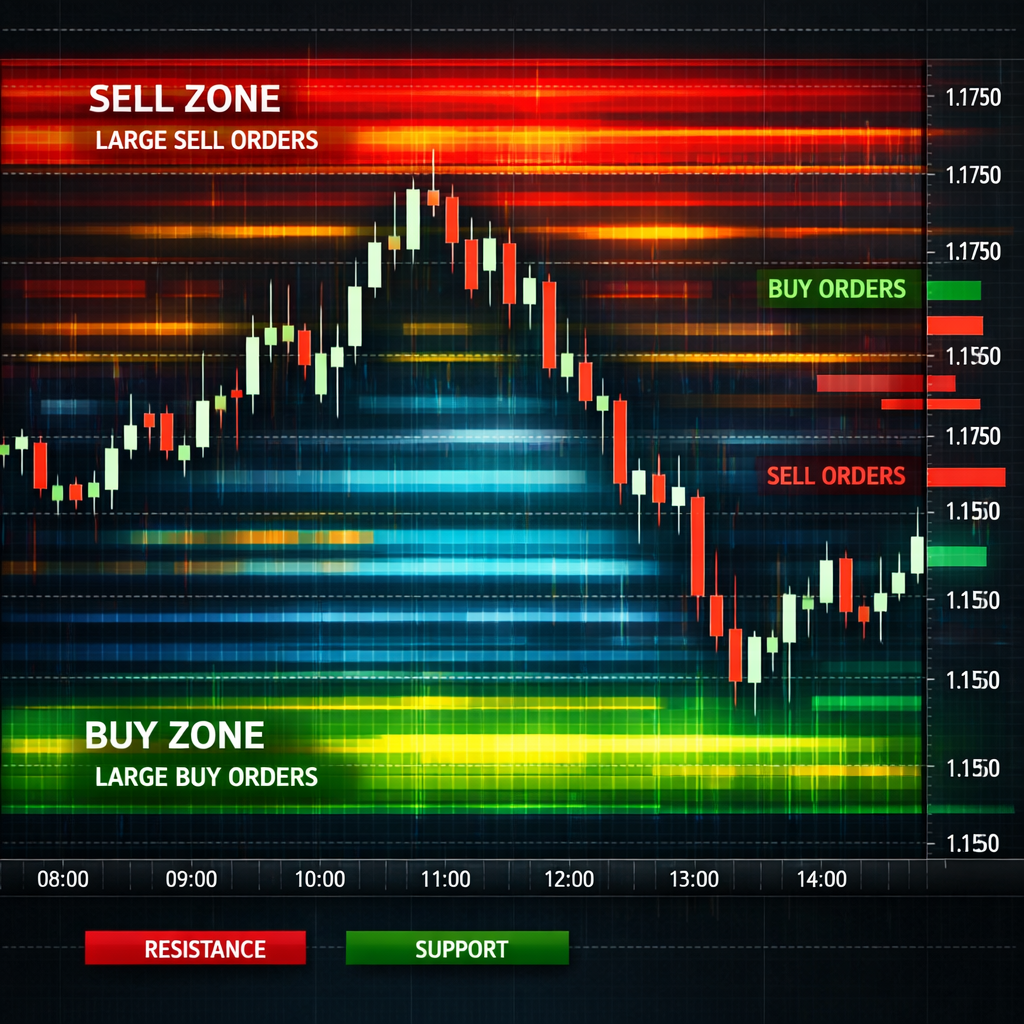
Liquidity pools are zones where a lot of limit orders sit. They appear as tall bars on the DOM or as bright clusters on a heatmap. When price approaches a pool, it can either bounce off (if the pool is strong) or break through (if aggressive market orders overwhelm it).
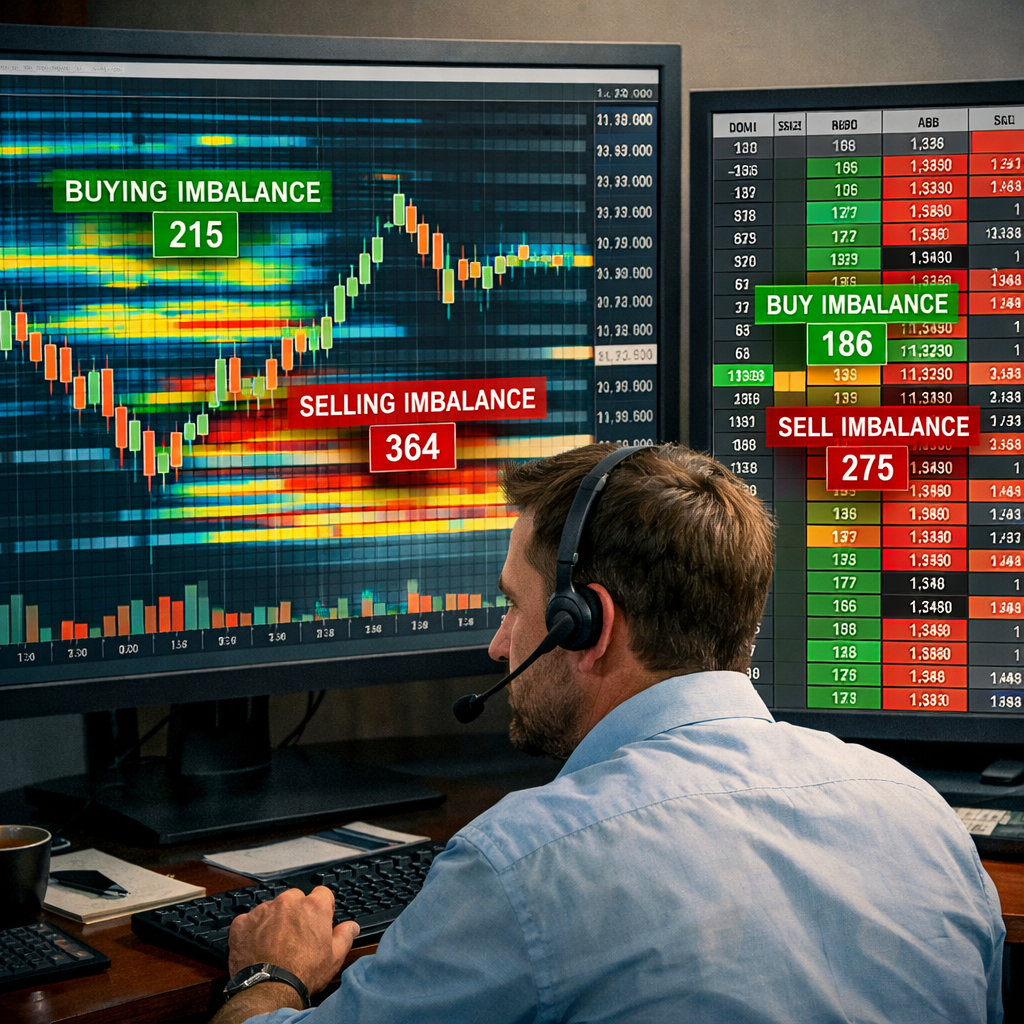
Imbalance shows up when the buy side greatly outweighs the sell side at a particular price. Bookmap calls this a “buy‑side imbalance” and highlights it with a green glow. A sell‑side imbalance glows red.
To spot imbalance, follow these steps:
- Open a heatmap or footprint chart that displays buy and sell volume per price level.
- Look for a price level where the volume delta spikes sharply to one side.
- Confirm that the order book shows a thin opposite side at the same level.
- Mark the level as a potential trigger point.
When an imbalance lines up with a known support or resistance zone, the chance of a meaningful move rises.
Bookmap’s learning center explains how to read these visuals. The platform even flags iceberg orders , large hidden orders that appear as a series of small trades. An iceberg can hint at institutional activity.
According to Bookmap’s imbalance guide, a strong buy‑side imbalance often precedes an upward breakout, while a sell‑side imbalance may foreshadow a down move.
Liquidity pools also act as “magnet” zones. If a pool sits just above a recent high, price may climb to test it before reversing. Conversely, a deep pool below a low can trap stop‑loss hunters.
Bottom line:Spotting liquidity pools and imbalances gives you early clues about price direction.
Step 4: Apply Order Flow to Entry and Exit Decisions
Now that you can read the order book and see imbalances, use that info to time entries and exits. Think of order flow as a traffic light: green means the flow is strong, red means it’s weak.
Entry example: You notice a buy‑side imbalance at a price that also marks a prior swing low. The DOM shows the bid side swelling, and the tape reports several large market buys. That combination suggests a short‑term bullish push. You could place a limit buy just above the imbalance, setting a stop a few pips below the nearest liquidity pool.
Exit example: After the trade moves in your favor, watch the CVD line. If it starts flattening while price still climbs, buying pressure is waning. That divergence often signals a good point to lock in profit.
Another tactic is “absorption”. When a large sell wall holds price down despite aggressive buying, the market is absorbing that pressure. Once the wall breaks, price can jump quickly. You can set a breakout entry just above the sell wall, with a tight stop below.
OANDA’s Order Book Indicator for MetaTrader 5 overlays client‑side pending orders and updates every 15‑30 minutes. While not real‑time, it still helps you see where retail liquidity clusters sit. See the OANDA order‑book page for details.
When you trade a breakout, watch the DOM for a sudden drop in ask volume. That drop shows that aggressive buyers have swept the sell side, confirming the breakout.
Conversely, if you see a rapid increase in bid size while price stalls, it may be a sign of a fake move. In that case, keep your stop tight or avoid the trade.
Bottom line:Order‑flow cues let you place trades where the market shows real buying or selling intent.
Step 5: Manage Risk Using Order Flow Insights
Risk control is the backbone of any trading plan. Order flow can help you size positions, set stops, and avoid over‑exposure.
First, size your trade based on the depth you see. If the bid side only has a few lots, a large position could move the market against you. Keep position size small relative to the visible liquidity.
Second, place stops just beyond the nearest liquidity pool on the opposite side. If you bought on a buy‑side imbalance, a stop a few pips below the next sell wall gives the market room to breathe without getting stopped out by noise.
Third, watch the CVD for signs of weakening momentum. If CVD plateaus while price still climbs, consider tightening your stop or taking partial profit.
Finally, avoid trading during periods when data is thin, such as the Asian off‑hours for major pairs. Thin liquidity means the DOM may show misleading spikes.
CM‑C Markets explains that order‑flow analysis can reveal supply and demand dynamics that traditional price charts miss. at CM‑C Markets order‑flow page.
Bottom line:Order flow gives you a clearer picture of where to size, stop, and adjust trades for safer outcomes.
Conclusion
Order‑flow analysis adds a live layer of insight that pure price charts can’t provide. By understanding the basics, setting up a DOM, spotting liquidity pools, turning flow signals into entry/exit rules, and weaving risk management into the mix, you build a more resilient trading process.
The FX Doctor community stresses education over hype. Use the steps above as a checklist, test each idea on a demo account, and only move to live capital once you feel comfortable with the flow signals.
When you combine order flow with solid market structure knowledge, you can react faster, avoid common traps, and improve the consistency of your trades. Keep learning, keep practicing, and let the market’s own data guide you.
FAQ
What does “order flow” actually mean in forex?
Order flow is the real‑time stream of buy and sell orders that hit the market. It shows which side , buyers or sellers , is more aggressive at any moment. By watching the flow, you can see why price is moving, not just where it has moved.
Can a beginner use order‑flow tools safely?
Yes, but start small. Begin with a simple DOM view and learn to read the tape. Practice on a demo account until you can spot clear imbalances. Pair flow signals with basic support‑resistance levels to reduce false starts.
Do I need a special broker to see order flow?
You need a broker that offers Tier 2 data or a platform that provides depth feeds. Many retail brokers give a limited view, while platforms like TradingView or Bookmap give richer visuals. Check your broker’s data plan before you start.
How often does the order‑book data refresh?
Refresh rates vary. Some platforms update every second, while others , like OANDA’s indicator , refresh every 15‑30 minutes. Faster updates give a clearer picture but may cost more in data fees.
What is the best way to set a stop loss using order flow?
Place your stop just beyond the nearest opposite‑side liquidity pool. If you bought on a buy‑side imbalance, set the stop a few pips below the next sizable sell wall. This gives the market room to breathe while protecting you from sudden reversals.
How does order flow complement other analysis methods?
Order flow shows the current intent behind price moves, while price action, trend lines, and indicators show the historical context. Using flow to confirm a breakout or reversal adds confidence, reducing reliance on any single method.