
Liquidity is the engine that moves every forex trade. When liquidity dries up, spreads widen, slippage spikes, and even the best chart pattern can fail. In this guide you’ll learn how to spot liquidity, read market depth, watch session shifts, gauge news impact, and use the insight to shape each trade plan.
We’ll walk through five practical steps, each packed with real‑world tips you can apply today. By the end you’ll have a checklist you can pull up before any trade.
Step 1: Identify Key Liquidity Indicators
Liquidity shows up in a few easy‑to‑track numbers. The most common ones are bid‑ask spread, volume, and order‑book depth. A tight spread means many participants are willing to trade at that price. High volume tells you that large sums are moving without shaking the market.
Start by pulling the spread from your broker’s quote window. If the spread on EUR/USD is 1‑2 pips during the London session, you’re in a deep‑liquidity zone. If it jumps to 5‑6 pips in the Asian off‑hours, expect higher costs.
Next, look at volume. Many platforms show tick volume, which approximates real trade count. A sudden rise in tick volume often signals institutional activity, which brings liquidity.
Finally, check order‑book depth if your ECN broker offers it. Depth shows how many lots sit at each price level. A thick stack of buy orders just below the current price creates a support cushion.
Remember that liquidity is not static. It changes with the time of day, news releases, and market sentiment. By monitoring these three indicators you can tell whether the market will absorb your order cleanly.
For a deeper dive on how spreads affect trading costs, see the Forex Broker Low Spreads Guide. Understanding how spreads shrink in high‑liquidity sessions helps you plan lower‑cost entries.
Wikipedia defines liquidity as the ability to buy or sell an asset quickly without moving the price. This simple definition underpins every number you watch.
Bottom line:Track spread, volume, and order‑book depth to get a quick snapshot of market liquidity.
Step 2: Analyze Market Depth and Order Flow
Market depth shows the hidden supply and demand behind the price. It’s like a backstage view of who wants to buy or sell and at what price.
Most retail platforms give you a Level II window that stacks buy (bid) and sell (ask) orders in rows. The rows closest to the current price are the most important because they are the first to be hit.
Watch for “walls” , large blocks of orders that sit a few pips away. A strong sell wall above the price can act as resistance, while a buy wall below can act as support. If a wall disappears suddenly, expect a breakout.
The table shows that the most liquid pair, EUR/USD, moves billions of dollars each day and keeps spreads razor‑thin. Depth numbers are often hidden, but ECN brokers reveal them in real time.
Order flow is the live stream of trades hitting the book. When you see a surge of market orders eating through the ask side, that’s buying pressure. When limit sell orders start to dominate, that’s a sign of impending downside.
Combine depth with order‑flow analysis: if a big buy wall holds and you see aggressive market buys breaking through, the market may be about to surge.
Keep an eye on the time stamp of the data. In forex the order book can lag by a few seconds, so act quickly when you spot a change.
Bottom line:Depth and order flow let you read the market’s hidden hand and anticipate short‑term moves.
Step 3: Assess Time‑Session Liquidity Variations
Forex runs 24 hours a day, five days a week. Liquidity rotates with the major financial centers , Tokyo, London, New York. When two sessions overlap, liquidity peaks. When only one is open, it thins.
The London‑New York overlap (8 am‑12 pm EST) is the most active window. You’ll see the tightest spreads and highest volumes. The Asian off‑hours (midnight‑4 am EST) are the quietest, with wider spreads.
Mark the calendar with the four main session blocks:
- Tokyo: 7 pm‑4 am EST
- London: 3 am‑12 pm EST
- New York: 8 am‑5 pm EST
- Sydney: 5 pm‑2 am EST
When you plan a trade, align your entry with the session that matches your style. Scalpers love the overlap, swing traders may prefer the quieter Asian session for lower noise.
“Liquidity spikes when the London and New York sessions overlap, giving traders the best chance for tight execution.”
Use a session heat‑map on your charting platform to visualize when liquidity is highest. Some platforms shade the background during overlap periods.
Watch for “session break” moments , the exact minute when one market closes and another opens. Those minutes often see a brief spike in volatility as orders from the closing market rush to the next.
By syncing your strategy with the liquidity rhythm, you reduce execution risk and improve trade‑cost efficiency.
Bottom line:Match your trade timing to the session that offers the liquidity you need.
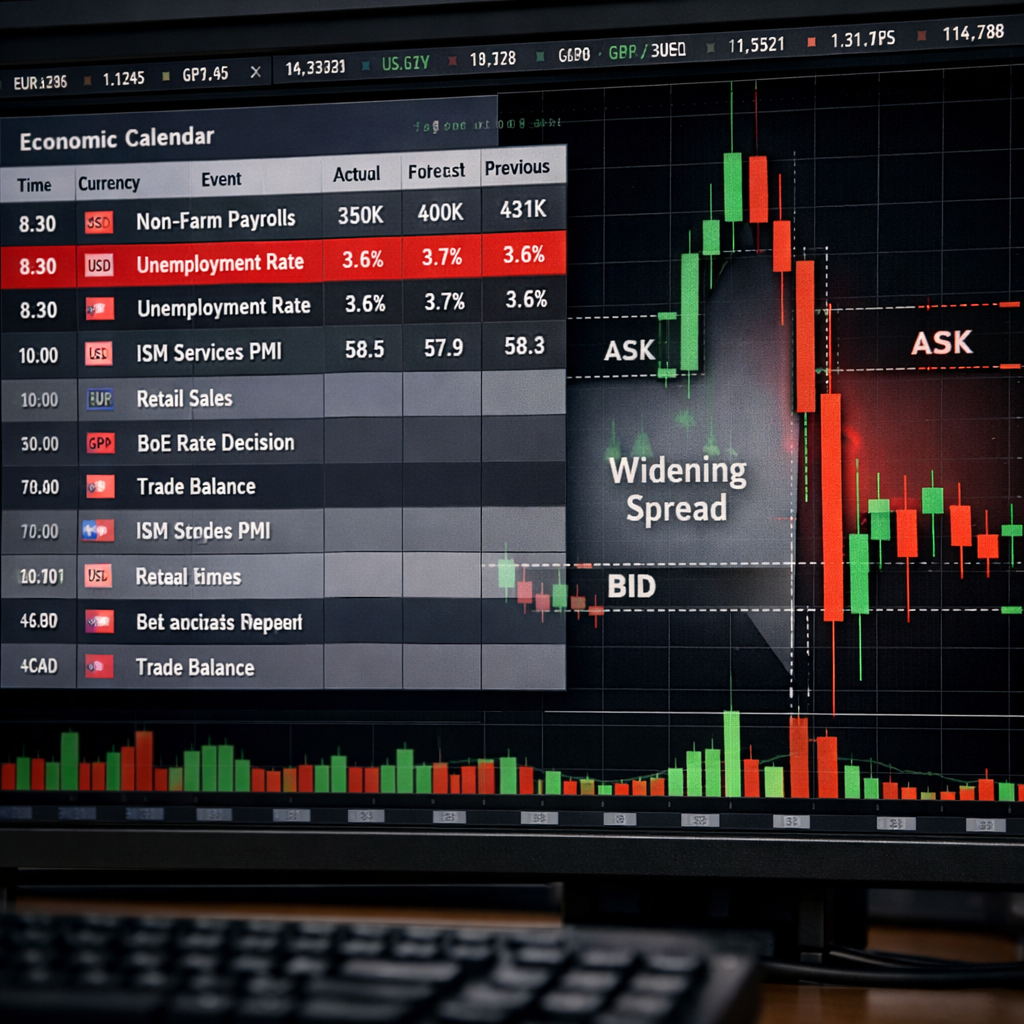
Step 4: Evaluate Economic Events’ Impact on Liquidity
News releases shake liquidity. When a major data point drops, market makers rush to adjust prices, and the order book can thin out fast.
Key events to watch include central‑bank rate decisions, non‑farm payrolls, CPI numbers, and GDP releases. During these times spreads can widen by several pips, and slippage becomes common.
One way to prepare is to check the economic calendar a day ahead. Note the time, expected impact (high, medium, low), and the currency pair it will affect.
For example, a surprise rate cut by the Fed often triggers a rapid outflow from the USD, thinning USD‑based pairs. Traders who entered before the news may see their stop‑loss hit at a worse price.
Liquidity also reacts to policy shifts beyond the headline numbers. The Federal Reserve’s liquidity‑swap lines, for instance, inject cash into the system and can temporarily boost market depth. The Fed explains these tools in its official swap program page.
When a high‑impact event is scheduled, consider widening your stop‑loss or switching to a wider‑timeframe chart. This gives the market room to breathe without triggering premature exits.
After the event, watch the order‑flow for a “liquidity refill” , a surge in volume and a return to tight spreads. That’s often a good moment to re‑enter.
Bottom line:Economic releases can thin liquidity; plan stops and position size accordingly.
Step 5: Apply Liquidity Insights to Trade Planning
Now that you can read spreads, depth, session timing, and news impact, put it all together in a trade‑planning checklist.
- Check current spread. If it’s wider than your normal range, wait.
- Confirm volume is above the 20‑period average. Low volume means thin market.
- Look at depth. A buy wall 3‑5 pips below the price adds confidence to a long.
- Match the session. If you need tight execution, trade during overlap.
- Review the economic calendar. Avoid opening new positions 15 minutes before a high‑impact release.
When all boxes are green, you have a high‑liquidity environment , the best setting for precise entries.
If any box is red, consider adjusting your strategy: use a limit order instead of a market order, widen your stop‑loss, or shift to a less volatile pair.
Remember that liquidity is not a static metric; it ebbs and flows. Treat your checklist as a living document you update as market conditions change.
By consistently applying these steps, you turn liquidity from a hidden risk into a clear advantage.
Bottom line:Use a step‑by‑step liquidity checklist to enter only when the market is deep enough for clean execution.
FAQ
What is the simplest way to tell if liquidity is low?
Watch the bid‑ask spread. If the spread widens beyond a few pips on a major pair, liquidity is thin. Pair that with a drop in tick volume and you have a clear signal to pause new entries.
How does market depth differ from volume?
Volume shows how many trades happened, while depth shows how many orders sit at each price level right now. Depth tells you whether a large order will move the price, even if recent volume was low.
Do all forex brokers provide order‑book data?
No. Only ECN‑type brokers aggregate liquidity from multiple providers and show a live order book. If your broker doesn’t, you may need a third‑party depth‑chart tool.
Why do spreads widen during news releases?
During high‑impact news, market makers protect themselves from sudden price swings. They widen spreads to cover the risk of rapid moves, which reduces execution quality for traders.
Can I trade safely during the Asian session?
The Asian session is quieter, so spreads are usually wider and price moves can be choppy. If you trade scalps, stick to the London‑New York overlap instead. If you trade longer‑term, the Asian session can be fine with wider stops.
How often should I review my liquidity checklist?
Do it before each trading day and again before any major news event. A quick 5‑minute review keeps you aligned with the current market environment.
Conclusion
Liquidity is the invisible force that decides whether a trade will fill cleanly or slip. By learning to read spreads, volume, depth, session timing, and news impact, you gain a clear edge. Use the five‑step checklist to filter out low‑liquidity moments and to plan entries that match the market’s depth. Over time the habit of checking liquidity will become second nature, and your trades will feel smoother and more predictable. Keep refining the checklist as markets evolve, and you’ll stay ahead of the liquidity curve.