
Sentiment moves the forex market faster than any single chart pattern. If you ignore it, you miss the crowd’s next turn. This guide walks you through the most useful forex market sentiment analysis techniques, from picking the right indicators to testing a full system.
By the end you’ll know how to spot crowd bias, blend it with price action, and build a repeatable edge that works for both scalpers and swing traders.
Step 1: Identify Relevant Sentiment Indicators
First, understand what sentiment actually means. In plain terms, it is the collective mood of traders toward a currency pair. Wikipedia defines market sentiment as “the overall attitude of investors toward a particular security or financial market” and notes that it can be measured with surveys, positioning data, and news‑driven scores. Market sentiment (Wikipedia)
Forex traders have a toolbox of indicators that capture that mood. Here are the most common ones you’ll see in practice:
- SWFX Sentiment Index, offered by Dukascopy, it shows the long‑short ratio of liquidity consumers (retail, hedge funds) versus liquidity providers (banks). The index updates every 30 minutes and reports a simple % difference (e.g., +20% means more longs than shorts).
- Speculative Sentiment Index (SSI), a snapshot of retail positioning across major pairs. Many brokers publish a live SSI widget.
- Commitment of Traders (COT) report, a weekly CFTC filing that breaks down positions of commercial hedgers, large speculators, and small traders. It reveals where the “smart money” is.
- VIX and risk‑off gauges, though the VIX tracks S&P 500 volatility, it still signals global risk appetite, which spills over into safe‑haven currencies like USD and JPY.
- Social‑media S‑Score, AI models scan Twitter, Reddit, and news feeds for bullish or bearish language, then output a numeric sentiment score.
Each indicator has a different latency and coverage. Real‑time tools (SWFX, SSI, social‑media scores) update intra‑day, while the COT and VIX lag by a day or a week. Choose a mix that matches your trading horizon.
If you need a deeper dive on how these indicators fit together, check out Forex Market Sentiment Analysis: A Step‑by‑Step Guide for 2026 Traders. It walks through each tool with screenshots and usable set‑up steps.
Step 2: Gather Real-Time Data Sources
Now that you know which indicators matter, you need a reliable feed. Real‑time data usually comes via API, WebSocket, or a broker‑provided widget. TraderMade, for example, offers a clean REST endpoint for both order‑flow (trade‑tape) and SSI data. Their documentation shows how to request live EUR/USD sentiment with a simple GET call.
Typical steps to get the feed:
- Sign up for a trial on the provider’s site and obtain an API key.
- to understand rate limits , most services allow 100‑200 calls per minute for free tiers.
- Write a small script (Python or JavaScript) that pulls the JSON payload every 30 seconds and stores the long/short percentages.
- Validate the data by comparing a few minutes of live values against the provider’s web widget.
- Push the cleaned data into your charting platform (e.g., TradingView custom indicator) so you can see sentiment overlaid on price.
When you test the feed, watch for two quality signals: low latency (under 150 ms) and high coverage (the provider should cover at least 10‑12 major pairs). TraderMade’s feed claims to aggregate data from “thousands of retail client accounts,” giving you a broad view of market bias.
Keep a backup source , many brokers publish a simple SSI chart on their client portal. If your primary API goes down, you can still read the sentiment from the broker’s page.
Step 3: Build a Composite Sentiment Index
Single indicators give a snapshot, but combining them yields a more strong signal. A composite index blends several metrics into one score, smoothing out noise while preserving the crowd’s overall direction.
Here’s a simple method you can code in a spreadsheet or a Python notebook:
- Pull the latest values for SWFX, SSI, and the COT large‑speculator net‑position.
- Normalize each series to a -1 to +1 scale. For percentage‑based data, divide by 100 and subtract 0.5 (so 0% = -0.5, 100% = +0.5).
- Assign weights based on your timeframe. For a day trader, you might give 50% weight to SSI, 30% to SWFX, and 20% to COT.
- Sum the weighted values to produce the composite score.
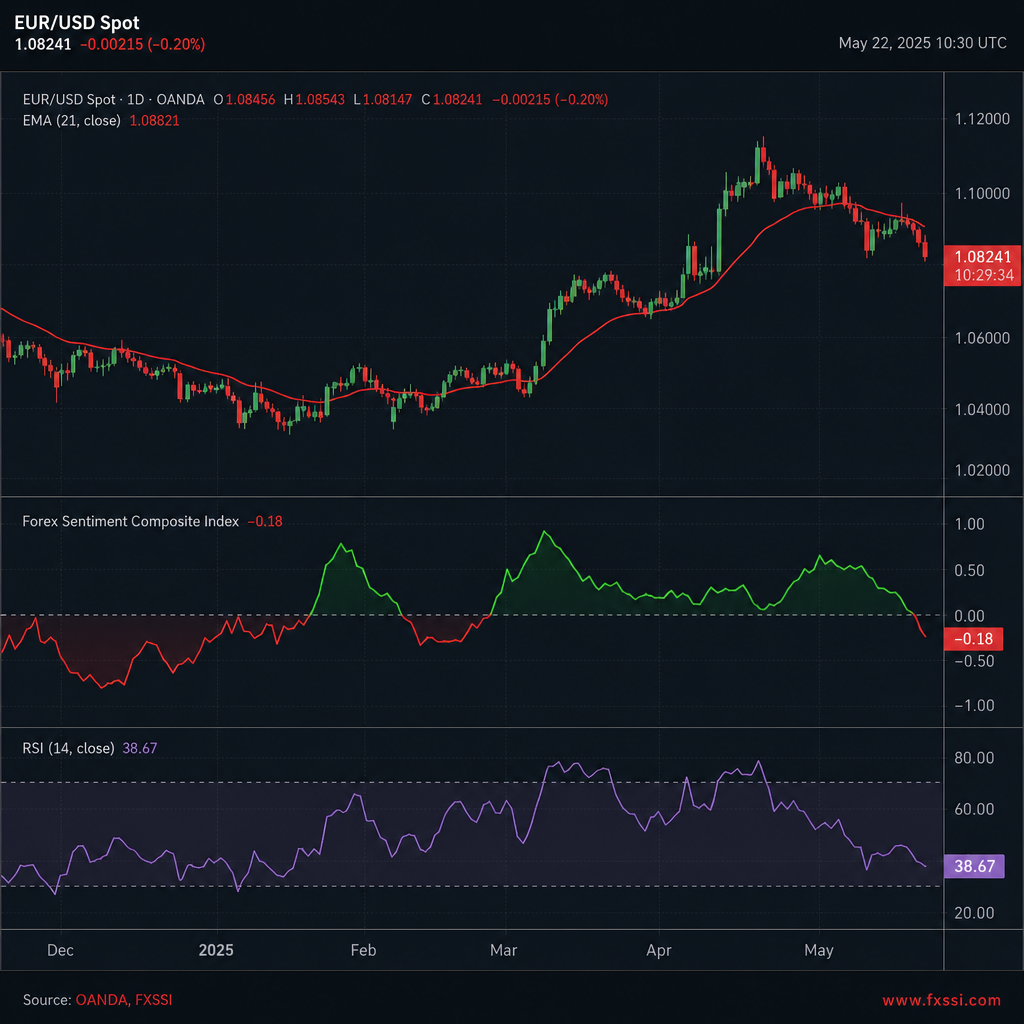
- Plot the composite line alongside price. Look for cross‑overs of the zero line as potential entry points.
Why weight at all? Real‑time metrics react quickly but can be noisy; the weekly COT adds a steadier “smart‑money” perspective. Adjust weights as you back‑test to see what mix gives the highest win‑rate.
In practice, a composite that swings from -0.3 to +0.3 often flags a shift in market bias. When the score flips from negative to positive, it suggests the crowd is turning bullish, and vice‑versa.
Back‑testing the composite is essential. Use historical sentiment data (many providers let you download CSV files) and run a simple strategy: go long when the composite crosses above zero and exit when it crosses back.
Step 4: Combine Sentiment with Technical Analysis
Sentiment on its own tells you how the crowd feels. Technical analysis tells you where price is likely to move. Marrying the two creates a powerful confirmation filter.
Start with a basic technical framework , for example, a 20‑period EMA and a Relative Strength Index (RSI) set to 14. When the EMA is sloping up and the RSI is below 70, you have a bullish context. Add sentiment to the mix:
- If the composite sentiment index is also positive, you get a strong “buy” signal.
- If the EMA is up but sentiment turns sharply negative, treat it as a warning of a possible reversal.
- Use extreme sentiment levels (e.g., composite > 0.6 or < ‑0.6) as a contrarian trigger , the crowd may be over‑extended.
Here’s a quick decision matrix you can copy into a spreadsheet:
Notice how sentiment either reinforces or contradicts the price‑based signal. This layered approach helps filter out false breakouts that often trap traders who rely on technicals alone.
“Sentiment is a powerful tool as its data is independent of the price.” , OANDA research
When you back‑test, record both the technical‑only results and the sentiment‑filtered results. You’ll typically see fewer losing trades, even if the total number of trades drops.
Step 5: Test, Refine, and Apply the Technique
All the theory means nothing until you see how it behaves on live data. Follow a disciplined testing routine.
- Historical back‑test: Use at least two years of price and sentiment data. Run the composite‑plus‑technical rule set and log each trade’s entry, exit, profit, and drawdown.
- Forward‑testing: Switch to a demo account. Trade the same rule set in real time for one month. Compare the live win‑rate to the back‑test results.
- Parameter tweaking: Adjust the weights in your composite, the EMA period, or the RSI thresholds. Keep changes small and track performance metrics after each tweak.
- Risk controls: Set a maximum risk per trade (e.g., 1% of account equity). Use a stop‑loss based on recent swing low/high, not just a fixed pip amount.
- Review and log: After each trading day, note when sentiment and technical signals agreed or conflicted. Over time you’ll see patterns that hint at the best times to trust sentiment.
The Federal Reserve’s COT report provides a reliable weekly anchor for the longer‑term part of the composite. According to the CFTC’s official filing, the report breaks down positions for commercial hedgers, large speculators, and small traders. CFTC COT methodology (Federal Reserve)
FAQ
What is the difference between real‑time sentiment and the COT report?
Real‑time sentiment (like SSI or social‑media scores) shows what traders are doing right now, updating every few minutes. The COT report is a weekly snapshot of futures positions filed by the CFTC. Real‑time data captures short‑term crowd bias, while COT reflects longer‑term institutional positioning. Using both gives you a fast‑acting signal plus a deeper, “smart‑money” perspective.
Can I rely solely on sentiment for trading decisions?
No. Sentiment tells you the crowd’s mood, but price still respects support, resistance, and broader fundamentals. The best practice is to combine sentiment with technical analysis and, where relevant, macro news. That way you avoid chasing false moves that are merely noise.
How often should I update my composite sentiment index?
For intraday strategies, update the composite at least every 30 minutes , that matches the refresh rate of most real‑time feeds. Swing traders can recalc once per day after the COT release. Consistency matters; irregular updates can lead to mismatched signals.
What tools can I use to pull sentiment data into my charts?
Many brokers offer widgets that you can embed in TradingView via the “External Data” feature. For programmatic access, providers like TraderMade deliver JSON over REST or WebSocket. Once you have the data, a simple Pine Script or Python routine can plot the composite line alongside price.
Is sentiment analysis useful for risk management?
Yes. Extreme sentiment levels often precede sharp reversals, so they act as early warnings. If sentiment shows 80% of traders are long, you might tighten stop‑losses on a long position or consider a small hedge. Conversely, a strong bearish crowd can justify reducing exposure on short positions.
How do I know which sentiment indicator fits my trading style?
Match the indicator’s latency to your timeframe. Scalpers benefit from SSI, social‑media scores, or order‑book data that refreshes every few seconds. Position traders prefer the weekly COT and VIX, which give a broader view of market bias. Test a few in a demo account to see which feels most reliable for the pairs you trade.
Conclusion
Forex market sentiment analysis techniques give you a window into the crowd’s collective mind. By picking the right indicators, feeding them with clean real‑time data, building a weighted composite, and then filtering technical signals, you create a layered system that can spot reversals, confirm trends, and tighten risk.
Start small: pick an SSI feed, add the SWFX index, build a simple composite, and back‑test against a 20‑period EMA. As you gain confidence, bring in the weekly COT report and fine‑tune your weights.
FX Doctor offers more educational resources to help you deepen each step, from data‑feed setup to advanced back‑testing methods. Keep learning, keep testing, and let sentiment become a steady ally in your forex toolbox.