
Hey traders, ever wonder why two of your forex trades seem to move in lockstep? You’re not alone. Many traders open positions on different pairs only to realize they are effectively doubling down on the same bet. That hidden link is called currency correlation. And once you understand it, you can trade smarter, manage risk better, and spot opportunities others miss.
In this guide, I’ll walk you through exactly what forex market correlation is, how to measure it, and how to use it in your daily trading. You’ll learn to build your own correlation matrix, identify the strongest relationships, and apply them to hedging and risk management. No fluff, just usable steps you can use today.
Step 1: Understand Currency Correlation and the Correlation Coefficient
Forex correlation is simply a measure of how two currency pairs move in relation to each other. When two pairs move in the same direction most of the time, they are positively correlated. When they move in opposite directions, they are negatively correlated. If their movements are unrelated, the correlation is near zero.
The standard tool to measure this is the correlation coefficient. It ranges from , 1 to +1. A coefficient of +1 means the pairs move perfectly together. A coefficient of , 1 means they move perfectly opposite. A coefficient of 0 means no relationship at all. In practice, you’ll rarely see perfect scores, but values above 0.7 or below , 0.7 are considered strong.
For example, Investopedia explains that EUR/USD and GBP/USD often have a correlation above 0.9, meaning they almost always move in the same direction. On the other hand, EUR/USD and USD/CHF typically show a strong negative correlation, often near , 1.0.
But here’s the catch: correlations change over time. A pair that was highly correlated last month might not be today. That’s why you need to check regularly. The research behind this guide found that across 12 major pairs, daily correlations averaged 0.70, but they ranged from , 0.72 to 0.95. That’s a huge difference. Even pairs from the same region can break apart , EUR/GBP posted a , 0.72 daily correlation, meaning the euro and the pound sometimes move opposite despite both being European.
So how do you read a coefficient? Think of it as a percentage. A coefficient of 0.89 means that 89% of the time the two pairs move in the same direction. That’s strong. Anything below 0.30 is weak and probably not useful for trading decisions. The key takeaway: always use the most recent data, and never assume a correlation is permanent.
Step 2: Identify the Most Strongly Correlated Currency Pairs
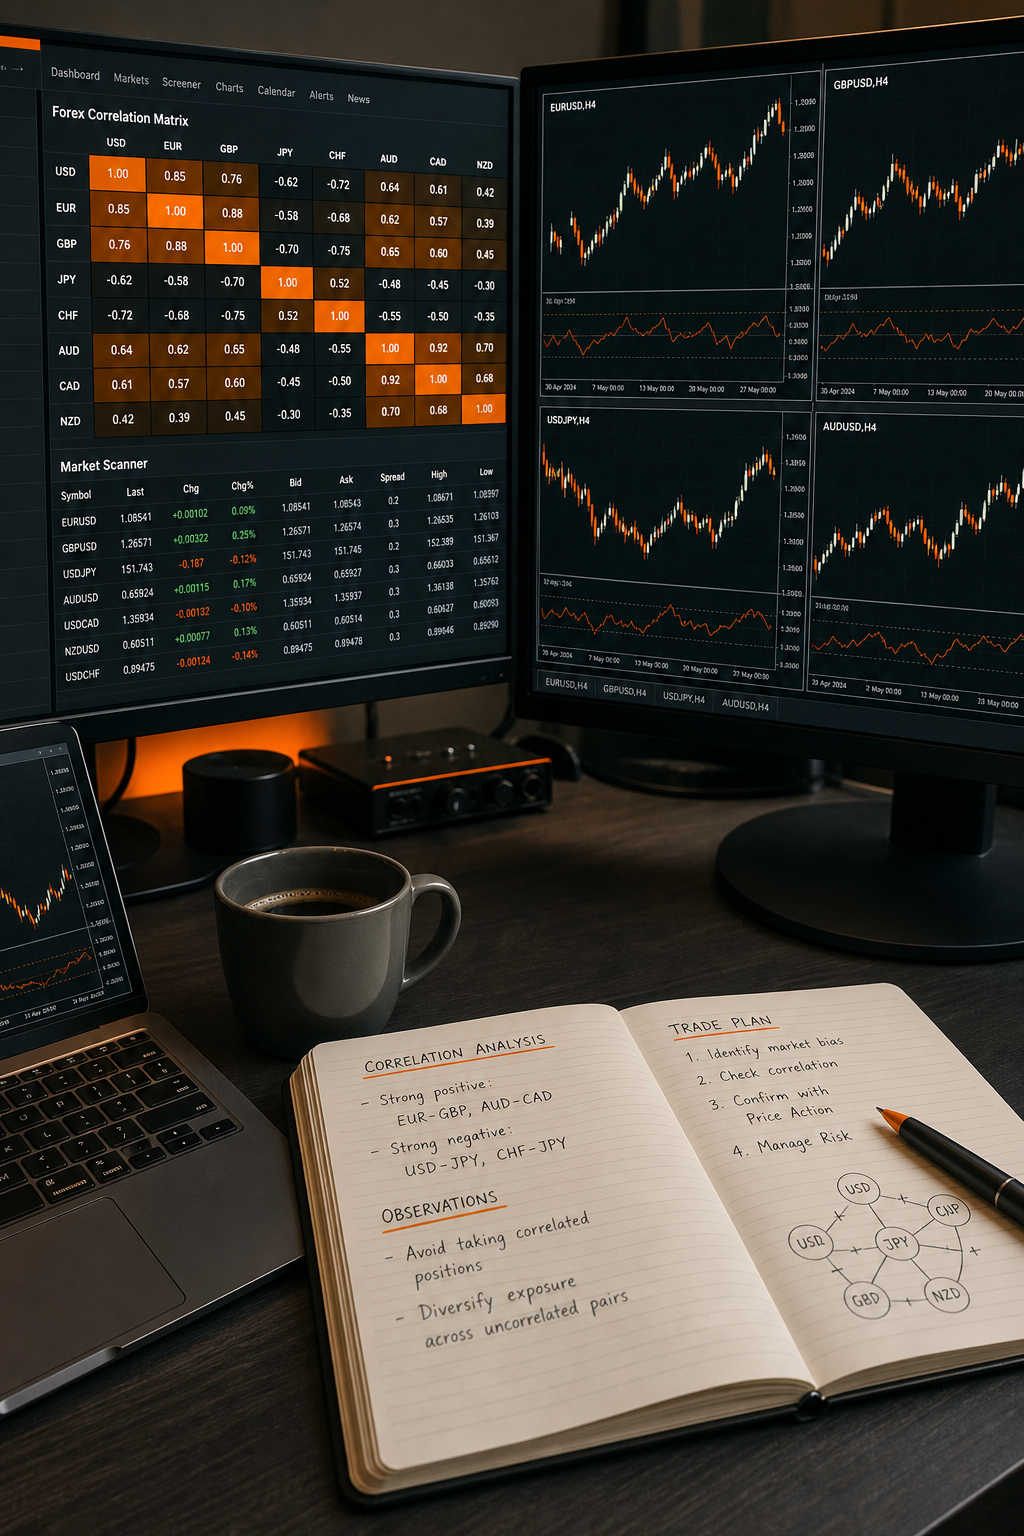
Now that you understand the coefficient, let’s look at which pairs are most correlated. Based on data from the research sources, here are the most notable relationships:
- Strong positive correlations (above 0.9): USD/JPY and USD/CHF (0.95), CAD/USD and USD/CAD (0.90), EUR/USD and GBP/USD (often 0.85, 0.95).
- Strong negative correlations (below , 0.7): EUR/USD and USD/CHF (around , 0.95), EUR/GBP and USD/JPY (variable, but EUR/GBP itself showed , 0.72 against the broader market).
- Moderate correlations (0.5, 0.7): AUD/USD and NZD/USD (around 0.8), GBP/USD and USD/CHF (negative around , 0.7).
Why do these relationships exist? Geographic proximity and trade links play a big role. European pairs move together because their economies are interconnected. Commodity currencies like AUD, NZD, and CAD are influenced by global commodity prices. The USD often acts as a safe haven, so pairs like USD/JPY and USD/CHF tend to rise together when risk sentiment drops.
But remember, past performance is not a guarantee. The YouTube source in the research noted that correlations can differ across timeframes. A pair might look strongly correlated on a daily chart but weakly on a 15-minute chart. Always check the timeframe you trade.
To identify current correlations, use tools like FXStreet’s correlation page or Myfxbook. Most platforms offer a free correlation matrix. CMC Markets also provides a good overview of common forex correlations.
Here’s a usable tip: when you find a pair you want to trade, check its top positive and negative correlations. If you’re long EUR/USD, see if GBP/USD confirms the move. If you’re hedging, consider a short position in USD/CHF. This step is the foundation of everything else.
Step 3: Build a Live Correlation Matrix in Excel or TradingView
You don’t need to rely on third-party tools forever. Building your own correlation matrix gives you control over the timeframe and pairs you care about. Here’s how to do it in Excel:
- Download historical price data. Most charting platforms let you export daily close prices for any pair. Get at least 20 days of data for a meaningful sample. 30, 60 days is better.
- Organize the data. Put each pair in its own column, with dates in the first column. Ensure all pairs have the same date range.
- Use the CORREL function. In Excel, the formula is =CORREL(array1, array2). For example, to find the correlation between EUR/USD and GBP/USD over the last 30 days, select the 30 price points for each pair.
- Create a matrix. List all pairs across the top and down the left side. Fill in each cell with the CORREL formula referencing the appropriate columns. This gives you a complete picture.
You can also do this in TradingView using the Correlation Coefficient indicator. It’s built into the platform , just select it from the indicators list and choose your reference pair.
Why build your own? Because static numbers on websites may not reflect the current market. The research showed that correlations can shift dramatically. For instance, USD/CAD and USD/CHF had a one-year correlation of 0.95, but the one-month correlation dropped to 0.28. If you relied on the yearly number, you’d think they were still strongly linked, but they weren’t. A live matrix catches these changes.
DataCamp offers a detailed Excel tutorial if you need more help with the technical setup.
Step 4: Analyze Commodity-Currency and Intermarket Correlations
Forex pairs don’t just correlate with each other. They also move with commodities, bonds, and stock indices. Understanding these intermarket links adds another layer to your analysis.
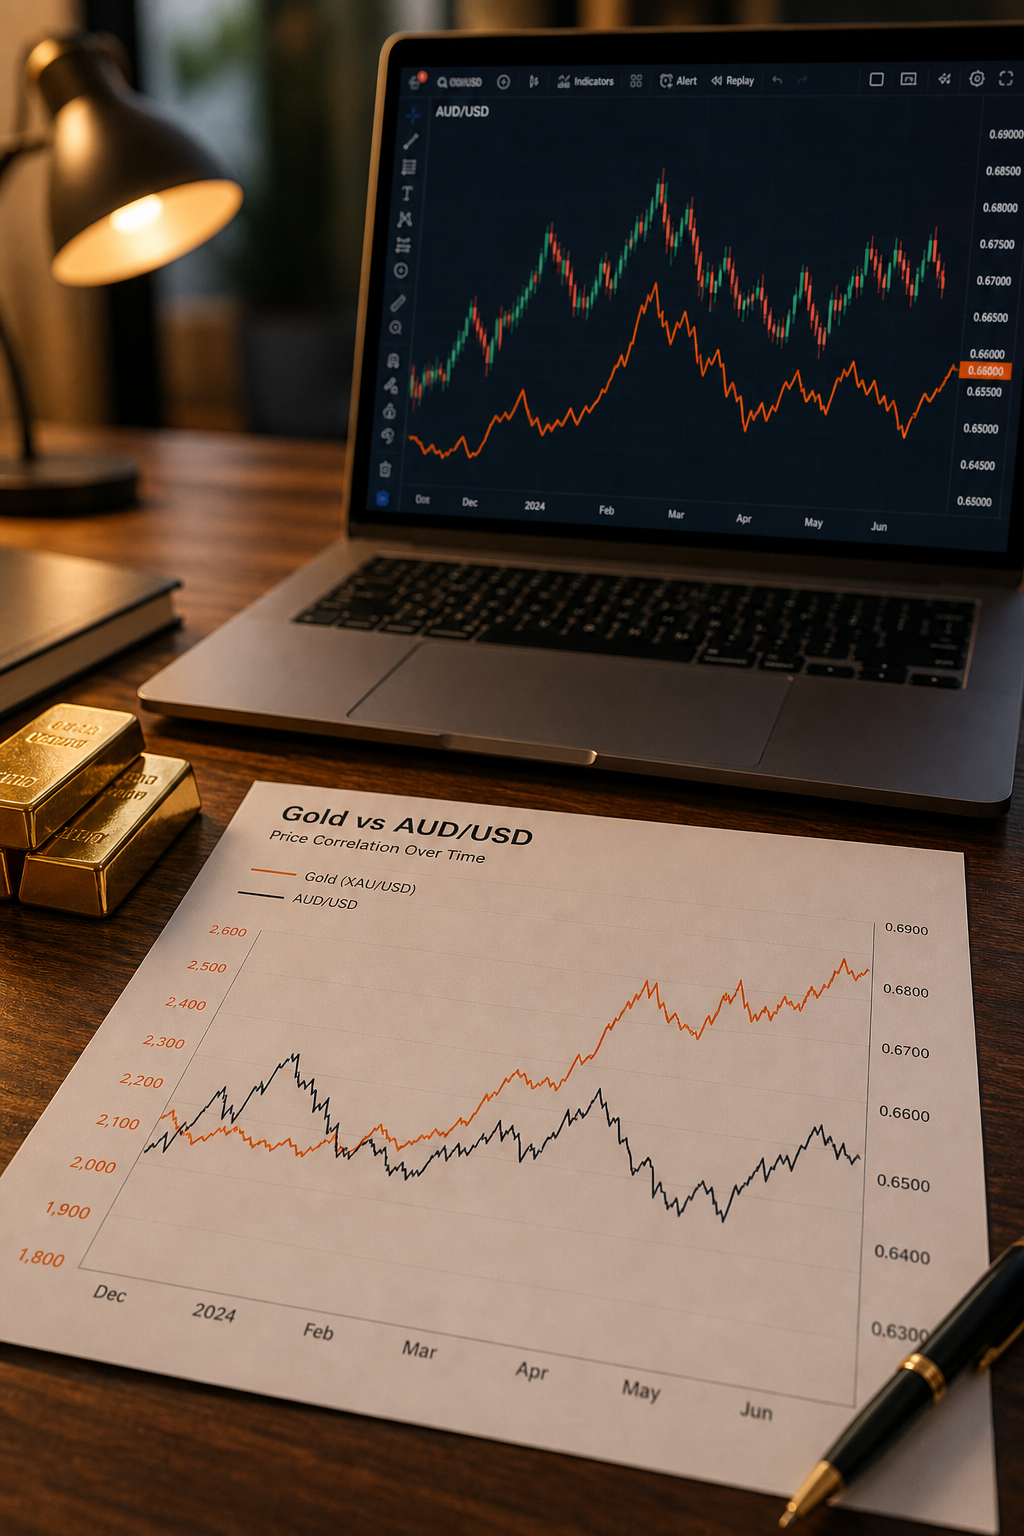
Commodity currencies are the most obvious example. The Australian dollar is closely tied to gold and iron ore prices. The Canadian dollar follows crude oil. The New Zealand dollar is linked to dairy and agricultural products. This is because these countries are major exporters of those commodities. When commodity prices rise, their currencies tend to strengthen against the USD.
For instance, tastyfx research highlights that the Canadian dollar has the highest correlation with crude oil. The AUD also correlates well with gold (around 0.5), but interestingly, GBP currently has a higher gold correlation at 0.55. That’s because the UK is a major gold trading hub.
There are also cross-asset correlations. The USD and gold usually move opposite, but during risk-off events, both can rise as safe havens. The Australian dollar sometimes moves with the S&P 500, reflecting risk appetite. The NZD often follows Chinese stock indices due to trade links.
To use this, watch commodity prices as an early signal. If oil spikes, expect CAD to strengthen. If gold dumps, be cautious with AUD longs. Build a separate matrix that includes key commodities and indices. Many trading platforms let you add these as symbols.
But don’t overcomplicate. Start with the most reliable relationships: CAD/oil, AUD/gold, NZD/dairy (using whole milk powder futures). Check these before you enter a trade. It’s a simple way to avoid surprises.
Step 5: Apply Correlation to Risk Management and Hedging
This is where correlation really pays off. Most traders focus on individual pairs and miss the bigger picture. If you have three open positions that are all strongly correlated, you’re not diversified at all , you’re just betting bigger on one direction.
Risk management: First, calculate the net exposure of your portfolio. Suppose you are long EUR/USD, long GBP/USD, and long AUD/USD. All three are positively correlated with each other (especially EUR/USD and GBP/USD). A USD rally would hit all three positions simultaneously. Instead, consider replacing one pair with a less correlated one, like USD/JPY, or a negative one, like USD/CHF. This spreads your risk.
Hedging: Use negative correlations to offset risk. The classic hedge is long EUR/USD paired with short USD/CHF. Because they usually move opposite, gains in one offset losses in the other. But be careful , the size of moves can differ. As Saxo Bank warns, perfect hedges aren’t perfect because of costs, slippage, and timing differences. You may still end up with a small net loss even if the direction is right.
A better approach is to use correlation for position sizing. If you have two highly correlated trades, reduce your lot sizes. For example, if you normally risk 1% per trade, risking 1% on two correlated pairs effectively risks 2%. Instead, risk 0.5% on each. Or use a portfolio risk model to keep total exposure under a set limit.
Below is a quick reference table for common hedging pairs:
Remember, correlations change. Always check the current coefficient before placing a hedge. And never hedge just for the sake of it , only do it when you have a specific risk to manage.
Step 6: Integrate Correlation into Your Trading Style
Different trading styles can use correlation in different ways. Let’s break it down:
Scalpers: Use 15-minute or 1-hour correlation data. Look for pairs that move in sync to confirm quick entries. If you see EUR/USD spike, and GBP/USD hasn’t yet, you can catch the lag. But beware that correlations on lower timeframes are noisier.
Day traders: The daily timeframe is best. Identify strong positively correlated pairs to confirm trends. If USD/JPY breaks out, check USD/CHF for confirmation. FXOpen suggests using moving averages and RSI on these pairs to align signals.
Swing traders: Use weekly and monthly correlations. Look for divergences , when two normally correlated pairs go separate ways, it often signals a reversal. For example, if EUR/USD and GBP/USD usually move together but suddenly diverge, one of them is likely to correct.
Position traders: Focus on macro correlations, like the link between commodity prices and currency strength. If you are long-term bullish on gold, you might be long AUD/USD as a proxy. Or if you expect oil to fall, consider shorting CAD/JPY.
No matter your style, always check the correlation matrix before adding a new trade. Ask yourself: “Am I taking on too much correlated risk?” If the answer is yes, adjust your position sizes or replace one pair.
To deepen your understanding, on Forex Market Sentiment Analysis, which complements correlation by showing you the broader market mood.
Conclusion
Forex market correlation isn’t a secret weapon , it’s a usable tool that every trader should use. By understanding the correlation coefficient, identifying strong relationships, building your own matrix, and applying these insights to risk management and your trading style, you can avoid common pitfalls like double exposure and make more informed decisions.
Remember, correlations are not static. They shift with economic data, central bank policies, and market sentiment. That’s why you should check your matrix regularly , at least once a week. And never assume a relationship will hold just because it did before. The only constant in forex is change.
Start small. Pick three pairs you trade most often. Calculate their correlations. Then adjust your position sizes based on what you find. Over time, you’ll develop an intuitive feel for how the market moves as a whole, not just as a collection of isolated charts. That’s the mark of a seasoned trader.
Frequently Asked Questions
What is the best timeframe for forex correlation analysis?
The best timeframe depends on your trading style. For day traders and swing traders, the daily timeframe offers the most reliable balance between recency and stability. Scalpers might use 15-minute to 1-hour data, but those correlations are more volatile. The research shows that daily correlations averaged 0.70 across major pairs, making it a solid choice for most strategies.
How often should I update my correlation matrix?
At least once a week. Correlations can change quickly due to economic events or shifts in sentiment. If you trade lower timeframes, checking every few days is recommended. A monthly review is the bare minimum. The key is to use a rolling window , typically 20 to 30 trading days , so your data stays current.
Can correlation predict forex market movements?
No, correlation is not predictive. It only describes historical relationships. Just because two pairs moved together in the past doesn’t guarantee they will in the future. However, correlation helps you understand current market structure and manage concurrent positions. For prediction, you need to combine it with fundamental and technical analysis.
What is the difference between correlation and causation in forex?
Correlation means two things move together; causation means one causes the other. In forex, a high correlation between AUD/USD and gold prices doesn’t mean gold price changes cause AUD moves , both are influenced by common factors like USD strength and global demand. Always be careful not to assume causation from correlation.
How do I find the current forex correlation matrix for free?
Many websites offer free correlation matrices. FXStreet has a dedicated page for major pairs with daily, hourly, and weekly data. Myfxbook also provides a correlation tool. Alternatively, you can build your own in Excel using freely available historical data from platforms like Investing.com or OANDA. This gives you full control over the pairs and timeframes.
Are there any currency pairs that are never correlated?
Pairs from unrelated economies with different drivers can show near-zero correlation. For example, EUR/USD and GBP/NZD often have very low correlation because GBP/NZD is influenced by UK and New Zealand factors, while EUR/USD depends on eurozone and US factors. No pair is perfectly non-correlated, but some are close enough to be useful for diversification.
What are the most common mistakes traders make with correlation?
The biggest mistake is assuming correlations are permanent. Many traders use old data and get caught off guard when relationships break down. Another common error is ignoring position sizing across correlated pairs , opening multiple high-conviction trades that are actually the same bet. Finally, some traders use hedging incorrectly, thinking a perfect hedge is risk-free, which it is not due to costs and execution differences.
How can I use correlation for portfolio diversification?
Select pairs with low or negative correlations to spread your risk. For instance, combine a EUR/USD long with a USD/JPY short (often inversely correlated). Also, include pairs from different blocs: commodity currencies (AUD, CAD), European pairs, and Asian pairs (USD/JPY, USD/SGD). The goal is to have positions that do not all move in the same direction at the same time. Regularly check your matrix to ensure the diversification is working.