
When you first hear the term forex, it often feels like a high‑stakes casino. Many traders jump in thinking they can chase quick wins. But the reality is a disciplined, knowledge‑driven approach is the only path that sticks.
This tutorial starts by laying out the market fundamentals that every trader, whether new or seasoned, must understand before they even open a chart. We’ll walk through what moves prices, how sessions interact, and the types of orders that give you precise control.
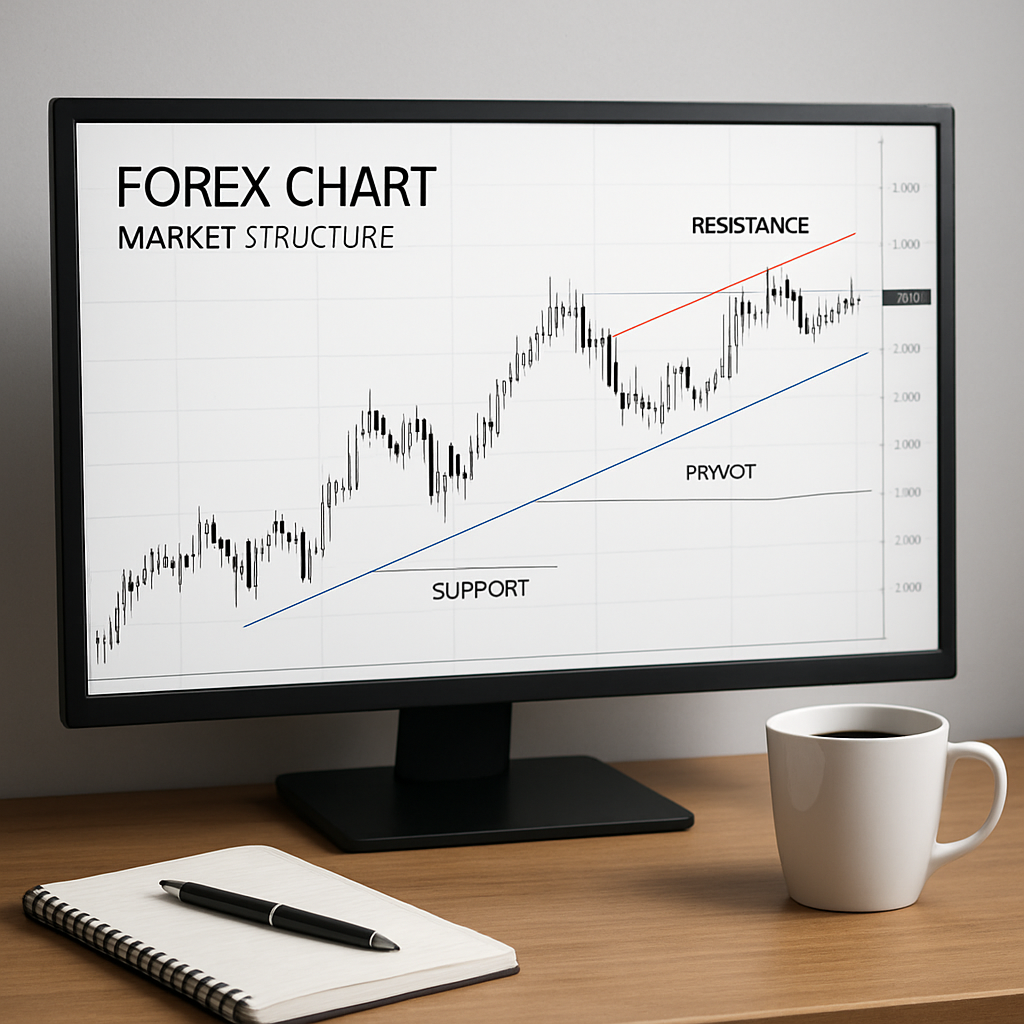
Next, we dive into market structure—the framework that tells you why a move is meaningful. By identifying trends, support and resistance, and key pivot points, you begin to read price like a map instead of a random walk.
Once you have the foundation, the next step is risk management. Position sizing, stop‑loss placement, and psychological discipline are the pillars that keep you from blowing a session. We’ll show how to calculate lot sizes and set realistic stop targets.
Now you might wonder, how do I practice without risking real capital? The answer is a structured learning path. A dedicated course that covers these concepts step‑by‑step can accelerate your progress. For example, enrolling in Courses – FX Doctor Master the Markets gives you guided lessons and real‑time practice scenarios. This structured approach also helps you identify patterns before they become obvious.
Finally, discipline is the glue that holds all the technical pieces together. Consistent study habits, routine trade reviews, and clear performance metrics prevent the common emotional swings that derail beginners. One practical tool to build that consistency is the Pomodoro technique.
Read the guide on how to plan weekly milestones with Pomodoros to keep your focus sharp and your study sessions productive: How to Plan Weekly Milestones with Pomodoros. Integrating this routine into your trading preparation will help you stay on track and make steady progress.
TL;DR
This forex trading tutorial walks you through market fundamentals, technical analysis, risk management, and disciplined execution so you can trade like a professional. By following the step‑by‑step logic and real‑world examples, you’ll build a repeatable system that keeps emotions in check and supports sustainable growth in the market day‑to‑day successfully.
Step 1: Understanding the Forex Market Structure
When you first look at a forex chart, you might think the price action is just random noise. Actually, it’s a story told in waves—market structure is the narrative framework that gives that story meaning.
In this first step, we’ll break down the building blocks that turn raw ticks into a readable story: sessions, trend phases, and key pivot points.
1.1 Sessions and the Global Time Machine
The forex market never sleeps, but it does have its own rhythm. Think of the major trading sessions—Sydney, Tokyo, London, and New York—as the four seasons of the market. Each session brings its own liquidity and volatility, and understanding their overlap can help you spot where price moves are most predictable.
When a session starts, you’re looking for a “kickoff” move that often sets the tone for the next few hours. That reaction can hint at the direction of the day’s main trend.
1.2 Trend Phases—The Pulse of the Market
Trends are simply the market’s way of telling you “keep going.” A trend has three phases: the impulse, the pullback, and the consolidation. An impulse is a sharp move in one direction, a pullback retraces a portion of that move, and consolidation is a period of indecision where price trades sideways.
Recognizing these phases lets you time entries and exits with the market’s natural rhythm. For example, entering a trade on the pullback after a strong impulse often gives you better risk‑to‑reward.
1.3 Pivot Points—Where the Story Rewrites Itself
Pivots are calculated levels that often act as future support or resistance. They’re derived from the previous period’s highs, lows, and close. When price approaches a pivot, it’s a good time to watch for a potential reversal or a breakout.
Many traders use pivot points to set their daily targets. If the market hits the first resistance and fails, that level can become a new support—signaling a possible shift in the trend.
To see how all these pieces fit together in real time, watch the short demonstration below.
Remember, market structure is not a set of hard rules; it’s a framework that adapts as you gain more experience.
If you want to streamline your trading workflow, try XLR8Well’s performance platform to organize your trade plans.
Also, consider Glassology Tech’s cloud analytics for deeper market insights that can complement your technical setup.
1.4 Using Structure to Set Trade Targets
Once you spot a trend and know the key pivot levels, you can turn that information into concrete trade targets. For instance, if the market is in a bullish impulse, you might set a target at the next resistance and a stop below the preceding swing low. This gives you a clear risk‑to‑reward ratio without guessing.
1.5 Why Structure Matters
Structure gives you a framework for decision‑making that’s less about emotions and more about probabilities. When you see that a price is breaking a pivot, you’re not just reacting—you’re following the market’s own logic, which can reduce impulsive entries and improve consistency.
Imagine watching EUR/USD on the 4‑hour chart. The market is a downtrend, swing highs around 1.1500 and swing lows near 1.1400. The next swing high is about 1.1450—a pivot. Short at 1.1450, target 1.1350, stop 1.1500: 100‑pip risk for 110‑pip reward, 1:1.1 ratio. This shows how structure sets realistic expectations.
Step 2: Mastering Technical Analysis and Market Trends
After you’ve mapped the market’s highs, lows, and pivot points, it’s time to ask: “How do I turn those patterns into a disciplined entry system?”
Re‑establishing Trend Validity
Start each session by drawing a trend line across the last three swing highs on the 30‑minute chart. If the price respects that line—bouncing off it or staying just above—it’s a good sign the bias is still alive. A single break can be a false alarm, so wait for a retracement that confirms the new direction before committing.
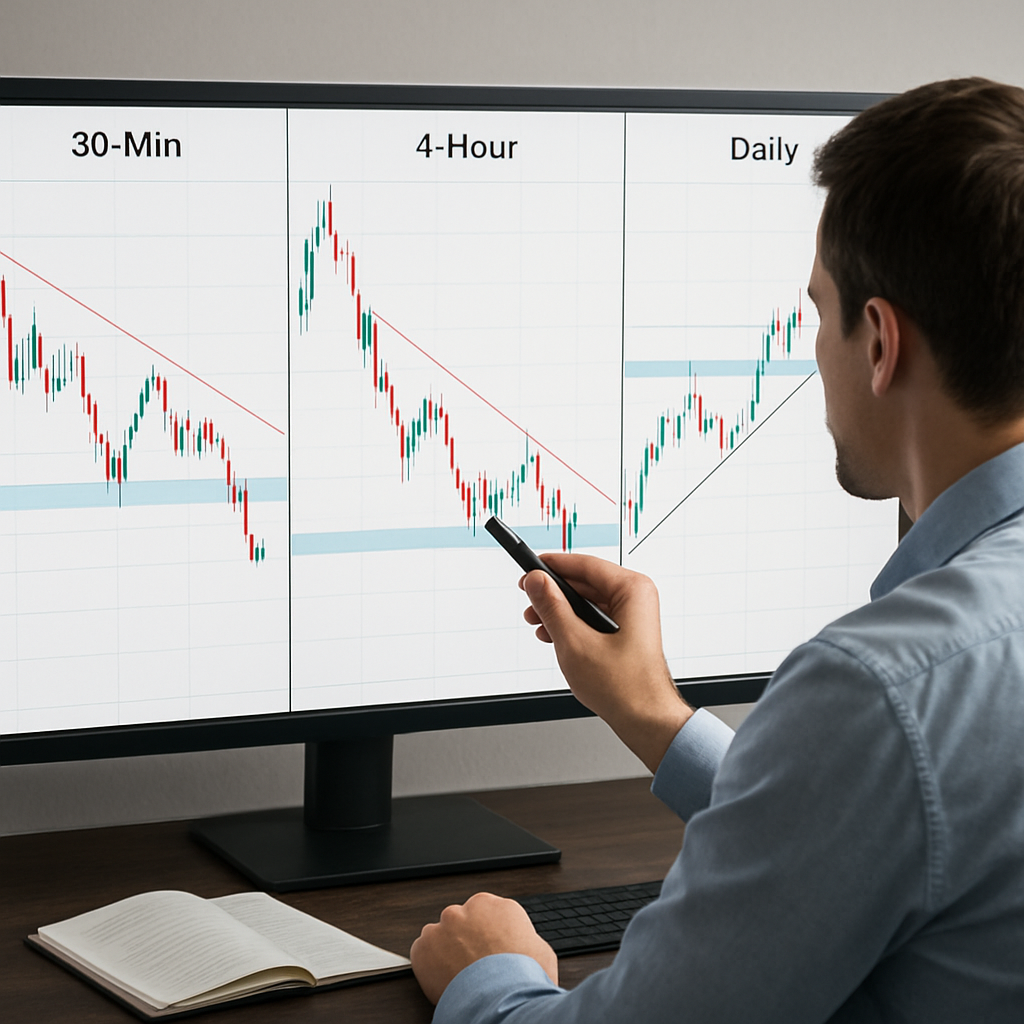
Aligning Multiple Time Frames
Once you’ve confirmed the 30‑minute bias, look to the 4‑hour chart. The same trend should be visible there. If the 4‑hour chart is flat or trending opposite, the 30‑minute move might be a short‑term flare. Keep the big picture in mind: institutional traders always check higher time frames for context.
Incorporating Momentum Filters
Add a lightweight momentum gauge, like the RSI set to 14 periods. In an uptrend, look for RSI readings below 70 but not over 30—those are the sweet spots where the market is still aggressive but not overbought. In a downtrend, target RSI values above 30 but below 70. This simple filter helps you avoid entering on a premature pullback.
Practicing Trade Confirmation
After you spot a valid trend, a matching higher‑time‑frame bias, and a momentum‑friendly RSI level, look for a clear break of the 30‑minute trend line. Mark the entry point, set a stop just below the recent swing low (or above the swing high for shorts), and calculate position size based on a 2% risk rule. Record the setup on a trade journal—this habit turns theory into muscle memory.
Does that sound like a plan you can follow? Try it tomorrow on the EUR/USD pair and note how each filter works in tandem. If one filter is silent, the others compensate. That redundancy is what keeps professional traders steady during market noise.
For a quick visual recap, check out this instructional video.
Finally, remember that technical analysis is a tool, not a crystal ball. Pair this disciplined approach with solid risk management and you’ll find your trade decisions become more consistent, not more profitable, because they’re based on repeatable logic.
Backtesting Your Setups
Before you go live, pull the last 100 days of data and run your entire filter chain. In Excel or your charting platform, create a column for the trend line break, another for the RSI level, and a third for the higher‑time‑frame bias. Then apply the 2% risk rule to each trade. Look at win rate, average win, and maximum drawdown. If the numbers don’t align with your risk profile, tweak the RSI thresholds or the time‑frame you’re observing. The goal is a reproducible, backtested system, not a perfect record.
Beware of Over‑Analysis
It’s easy to fall into the trap of chasing every signal. If you need to check three charts, four indicators, and a volatility band before placing a trade, you’re likely over‑analyzing. Keep it simple: trend line break + RSI confirmation + higher‑time‑frame bias. That’s three signals, not an exam. If you hit a wall, pause and step back—sometimes the market’s noise is louder than the signal.
Integrating Market Context
Beyond technicals, note the economic calendar. A major data release can override a clean trend. For instance, a bullish 4‑hour trend might still break on an unexpected CPI report, pushing the market into a volatile swing. By layering a short‑term news filter—just a simple “no trade after a major release”—you protect your setup from surprise shocks.
Checklist Before You Trade
• Confirm the 30‑minute trend line is intact.
• Verify the 4‑hour bias matches.
• Check RSI is in the 30–70 band.
• Wait for a clear break and retest.
• Place a stop just outside the recent swing.
• Size your position for 2% risk.
• Record the trade and review the outcome.
Final Thoughts
By following this structured sequence, you build a framework that is both rigorous and adaptable. Practice daily, review your journal, and refine the thresholds until you feel confident. That discipline is what separates consistent traders from the rest.
Step 3: Applying Support, Resistance, and Price Action
Now that you’ve mapped the trend and checked your bias, it’s time to layer on the real‑world signals that turn a chart into a trading plan.
1. Identify horizontal zones first
Look for levels where price has stalled, bounced, or reversed multiple times. These are your support and resistance zones. Even a single strong retest can confirm that a level is meaningful.
Use a simple rule: if price touches a level at least twice and shows a clear reaction, mark it. The more retests, the stronger the confluence.
2. Confirm with price action patterns
Once zones are on your chart, scan for classic price‑action patterns that play out against them: double tops, head‑and‑shoulders, and pin bars. These patterns give you entry and exit signals without the noise of lagging indicators.
For example, a bullish pin bar at the bottom of a support zone often signals a breakout into the trend. Conversely, a bearish reversal candle near resistance may signal a pullback.
3. Use the support‑resistance break as the trigger
When price finally breaks above a resistance level with a clear candle, treat that as your trade trigger. Wait for a retest of the broken level—if it holds as new support, that’s confirmation of momentum.
For a short position, look for the opposite: a clean break below support and a retest of that level as new resistance.
4. Set realistic stops around the zone
A stop just beyond the next key level keeps risk under control. For a long, place the stop a few pips below the nearest support; for a short, a few pips above the nearest resistance.
Always calculate the distance to the stop and adjust position size so that a single trade risk equals 2% of your account.
5. Verify with the higher‑time‑frame bias
Confirm that your entry aligns with the higher‑time‑frame trend. If you’re trading a 30‑minute chart, the 4‑hour bias should agree; otherwise, consider waiting for alignment.
6. Practice on historical data
Apply your support‑resistance logic to the past 100 days of price data. Record every trigger, stop, and exit. Afterward, review win rates, average reward, and maximum drawdown. This exercise turns theory into a repeatable system.
7. Keep it simple and disciplined
In a fast‑moving market, the simplest setups often perform best. Avoid adding extra filters unless they provide clear, independent confirmation.
Remember: a clean break, a retest, a stop near the next level, and proper sizing is a robust foundation for any prop‑style trade.
For an in‑depth look at how support and resistance are defined and applied in price‑action trading, see the educational series at Price Action University.
By mastering these steps, you’ll move from chasing charts to making disciplined, evidence‑based decisions—exactly the skill set required for institutional‑style trading.
Step 4: Multi‑Timeframe Analysis and Confluence Trading
After you’ve nailed the basics of support, resistance, and risk, it’s time to layer on the professional touch: multi‑timeframe (MTF) analysis. Think of it as reading a story in chapters, then flipping back to the beginning to see how the plot started.
Why Multi‑Timeframe Matters
Traders who only look at a single chart miss the bigger picture. A 30‑minute breakout can be a short‑term flare, but if the 4‑hour trend is bearish, that move is likely a temporary retracement.
In practice, the higher‑time‑frame confirms the bias of the lower one. That confirmation reduces false signals and aligns your trade with institutional flow.
Building Confluence
Confluence is the sweet spot where at least two independent signals agree. For example:
- Price breaks above a 30‑minute resistance zone.
- The 4‑hour chart shows an upward slope of two consecutive higher highs.
- The 1‑hour RSI is between 30 and 70, indicating room for movement.
When all three lines point in the same direction, the probability of a sustained move increases dramatically.
Step‑by‑Step Workflow
- Mark the bias on the daily chart.
- Draw trendlines on the 4‑hour chart.
- Identify the key support/resistance on the 30‑minute.
- Look for a confluence trigger.
- Set stop and take‑profit.
- Size the position.
Common Pitfalls
Many traders over‑complicate by adding too many indicators. Remember, each new filter should provide independent confirmation, not just a duplicate of the trend.
Avoid trading during major news releases on the higher‑time‑frame. Even if the MTF confirms a bias, a sudden data release can wipe out that setup.
Practical Example: EUR/USD
Suppose you’re on the 30‑minute chart of EUR/USD. A bullish pin bar appears at the 1‑hour low, breaking the 30‑minute support you previously marked. Meanwhile, the 4‑hour trend shows two higher highs, and the 1‑hour RSI sits at 48. All three signals align.
Enter long, place the stop at 30 pips below the 30‑minute low, size the lot so that a 30‑pip loss equals 2% of the account. That’s a textbook confluence trade.
Checklist for Execution
- Daily bias confirmed.
- 4‑hour trend aligns.
- 30‑minute trigger identified.
- 1‑hour RSI in 30–70.
- Stop and target set.
- Position sized for 2% risk.
| Item | What to Check | Why It Matters |
|---|---|---|
| Higher‑time‑frame trend | Same direction as lower frame | Reduces false breaks |
| Confluence trigger | At least two independent signals | Increases probability of success |
| Stop placement | Just outside the next level | Keeps risk controlled |
A practical tip: always record the exact timestamp of the trigger and the time it takes to reach your target. This data helps refine your timing and identify if certain time blocks, like the 6‑am London session, consistently yield better confluence.
Remember, the goal isn’t to hit every trade, but to maintain a high‑quality entry pipeline. Over time, a disciplined MTF approach reduces emotional noise and aligns you with the broader market narrative.
A concise visual walkthrough, watch the video tutorial that breaks down each step.
By consistently applying multi‑timeframe confluence, you move from a reactive trader to a disciplined professional who trades in line with market structure.
Step 5: Managing Risk with Position Sizing and Drawdown Control
After you’ve nailed your entry logic, the next big step is making sure every trade stays within a size you’re comfortable losing. Think of position sizing as the safety net you put on a high‑wire act.
Define a Fixed Risk per Trade
Start by deciding how much of your account you’ll allow to fall in one swing. Most seasoned traders cap this at 1–2%. In our experience, setting a hard stop of 2% keeps the emotional roller‑coaster to a minimum.
Calculate the Pip Value
On a 5‑minute EUR/USD, one pip equals $0.50 on a standard lot. If you want a 30‑pip stop, that’s $15. Divide that figure by your 2% risk tolerance to find the lot size that aligns with your rule.
Adjust for Volatility
Markets move in waves. A 30‑pip stop in a quiet session is fine, but during a news release it could expand to 60‑pips. Use an average true range (ATR) to gauge how wide the stop should be. The ATR on a 30‑minute chart gives you a volatility‑adjusted buffer.
Protect Against Drawdowns
A single losing streak can wipe out a lot of that 2% cushion. To keep your account from spiraling, set a maximum drawdown threshold—say 10% of equity. When the equity dips below that, pause trading to reassess your strategy.
Implement a Position‑Sizing Formula
Here’s a quick recipe you can copy into a spreadsheet: Position Size = (Risk Amount ÷ Stop Size) × 0.01. Plug in the risk amount ($200 for a 2% of a $10,000 account) and the stop in pips. The result tells you how many lots to trade.
Test in a Demo First
Before you deploy real money, run the same calculations on a demo account for at least a month. Watch how the stop size changes with volatility and how your equity curve behaves. The demo is your sandbox to tweak the formula until you feel confident.
Keep a Risk Log
After each trade, jot down the lot size, stop distance, and the final outcome. Over time, this log turns into a personal research lab. Patterns emerge—maybe you’re consistently over‑sizing on a particular pair. Adjust and repeat.
Review Your Drawdown Regularly
Set a weekly review of your equity curve. Look for the steepest decline and ask: was it a market event or a sizing slip? If it’s the latter, tighten the 2% rule or adjust the ATR multiplier.
Use a Dedicated Risk‑Management Tool
While many brokers offer built‑in calculators, a simple spreadsheet or a free risk calculator can provide clarity. Keep the tool updated as your account balance grows; the 2% risk amount should scale automatically.
So, what’s the takeaway? Position sizing isn’t a fancy trick—it’s a disciplined framework that keeps you from chasing big losses. By locking in a fixed risk, scaling with volatility, and guarding against drawdowns, you create a safety net that lets you focus on the trade itself.
For a visual walkthrough, watch this concise video that breaks down position sizing and stop‑loss placement step by step.
When you’re ready to trade a new pair, run the same formulas in your risk log. If the calculated lot size feels too large, revisit your stop distance or your 2% rule until the numbers feel right.
Keep this routine consistent, and over months you’ll notice your equity curve stabilizing, even when markets swing unpredictably.
Step 6: Developing Trading Psychology and Discipline
That jittery feeling before you click “send” is your brain’s way of saying, “Something’s off.” Instead of letting it drive you, let’s turn that nervous energy into calm confidence.
1. Name the emotion
Write down what you’re feeling in a quick journal note. Fear, greed, excitement—label it. Naming the feeling creates a mental space where you can decide how to respond.
Ask yourself: “What am I hoping to get out of this trade?” Often the answer reveals the bias you need to counter.
2. Build a pre‑trade checklist
- Market bias matches my strategy?
- Clear entry, stop, and profit target defined?
- Risk per trade capped at 2% of equity?
- Day’s mental state is sharp enough to execute?
Checking every item before you open a position removes the impulse to guess.
For a visual walkthrough of a disciplined trade routine, watch this educational video here.
3. Apply the “pause” rule
When a trade idea pops up, count to ten. If you’re still drawn to it after that, revisit the checklist. Skipping a step here can cost you a disciplined trade.
Imagine a day where you never missed a single checklist item—discipline would be the default, not the exception.
You can also pair the pause with a physical cue, like tapping the desk twice, to make the wait automatic. This small gesture conditions your mind to accept delay rather than denial.
4. Keep a detailed trade log
Record every trade, including the emotional state you experienced.
Over time you’ll see patterns—maybe you trade more aggressively after a loss or only feel confident in the afternoon.
Turning intuition into data gives you evidence to tweak your approach.
5. Use the risk‑reward filter
If the potential loss exceeds the potential gain, the trade feels too risky.
Apply a 1:2 or 1:3 reward‑to‑risk ratio as a gatekeeper.
If the math doesn’t add up, say no.
Why does this matter? It keeps your mind from chasing high rewards without clear justification.
6. Anchor your routine to mindset
- Start with 3 minutes of deep breathing to center yourself.
- Allocate a 15‑minute “trade‑prep” window for review.
- Finish with a 5‑minute reflection on emotions and decisions.
Consistency trains your brain to respond automatically rather than reactively.
7. Separate process from outcome
Ask yourself, “Did I follow the plan?” rather than “Did I make money?” The outcome is a result of your disciplined actions, not the driver.
When you reflect on your process, you’re less likely to blame the market for a loss.
8. Bring in a trading companion
Share your journal with a trusted peer or coach who can spot emotional patterns you might miss.
A fresh pair of eyes can act as a reality check.
Does this sound like a useful resource? Many traders find that accountability reduces the “I’m a genius” bias.
9. Simulate discipline in a demo account
Run your full checklist in a demo for a week.
Note any deviations and adjust before you risk real capital.
Rehearsing builds muscle memory for disciplined execution.
10. Quarterly review and reset
Schedule a quarterly date to evaluate how closely you stick to your discipline rules.
When you revisit your quarterly review, compare actual trade outcomes with the journal entries to spot any emotional drift. Adjusting the 2% risk rule if you notice a trend in loss streaks keeps your plan tight.
Celebrate wins, tweak thresholds, and update your journal template.
What’s the single takeaway? Discipline is a habit you cultivate, not a skill you acquire overnight.
Apply the checklist, pause, journal, and you’ll see a measurable shift in both performance and mental resilience.
For deeper insight into trading psychology, watch this clip that dives into the mindset of professional traders here.
Conclusion
We’ve walked through every layer of a professional trading routine, from market structure to psychological resilience.
What ties it all together is habit—small, repeatable steps that become muscle memory.
Start each session by confirming the daily bias, then drill down to the 30‑minute trigger, set a tight stop, and size for a 2 % risk. Record it. Review it. Repeat.
In practice, that routine turns the noise into a signal you trust, so you’re not chasing emotions.
Remember that discipline is a marathon, not a sprint. Quarterly reviews keep your system aligned with your evolving market view.
What’s the single most actionable takeaway? Treat your journal as a coach: note every deviation, ask why, then adjust. That feedback loop is what separates consistent traders from the rest.
Now it’s your turn to put the plan into motion. Pick one chart, apply the checklist, and hit “trade” when every box is ticked.
Once you’ve done that for a month, revisit your notes. Look for patterns in win‑rate or drawdowns. Fine‑tune your stop or risk rule if the data suggests a tweak.
So, are you ready to trade like a professional? The tools are in your pocket—just the discipline and consistency you’ve just built.
FAQ
What’s the fundamental difference between forex and other financial markets?
Forex is a global, decentralized market that trades currency pairs 24 hours a day. Unlike a stock exchange, there’s no central venue and prices are driven by macro‑economic flows, central bank actions, and geopolitical events. That means you can trade across all major sessions, but you also need to stay sharp on liquidity levels and volatility spikes that can occur at any time.
How often should I review my trade journal to stay on track?
A weekly review is a good baseline for most traders. It lets you spot patterns in entries, stops, and outcomes without getting overwhelmed by daily noise. If you’re testing a new strategy, consider a bi‑weekly review so you capture enough data points to assess win‑rate, average reward, and drawdown before adjusting the system.
What’s a practical way to set a stop‑loss that keeps my risk at 2 %
First calculate the dollar amount you’re willing to risk: 2 % of your account balance. Then determine the pip distance from your entry to a logical stop—often the nearest swing low or a multiple of the ATR. Divide the dollar risk by the pip value to get the position size. This keeps each trade’s risk consistent and ties size directly to market volatility.
Why does market structure matter for a professional trader?
Market structure tells you the “story” the price is telling. Identifying higher highs, lower lows, and support or resistance levels lets you trade with the market flow instead of against it. A clear structure reduces false breakouts and provides a framework for entry, stop, and target placement, which is especially important when operating under the strict rules of a prop firm.
How can I prevent over‑analysis from killing my trade decisions?
Set a hard limit on the number of confirmation signals you’ll use—ideally three: a trend‑line break, a higher‑time‑frame bias, and a momentum gauge. Stick to those signals and ignore additional indicators or retests until you’ve made a decision. If you feel uncertain, pause, refocus, and revisit the core criteria; that discipline is a safeguard against reactionary moves.
What steps should I take when volatility spikes during a trade?
First, re‑check your stop‑loss level: a spike can widen the spread and widen the effective stop distance. If your stop is too far from the entry, consider tightening it or scaling down your position size for that period. If you’re in the middle of a trade, avoid adding to the position; focus on protecting the current risk‑to‑reward balance.
How do I align my personal trading plan with a prop firm’s requirements?
Most prop firms enforce strict risk limits, position size caps, and daily loss thresholds. Map each rule to a component of your plan: set your 2 % rule, cap your position size at the firm’s maximum lot, and pre‑define a daily stop‑loss. By embedding these constraints into your routine, you turn firm rules into part of your trading discipline rather than an external restriction.