Liquidity pools are the hidden magnets that move prices faster than you can blink. If you don’t know where the big banks park their stop orders, you’ll be caught in the middle of a price‑hammer. In this guide you’ll learn eight usable forex liquidity pool trading strategies, see how each one works on real‑time charts, and get a quick comparison so you can pick the right tool for your style.
We’ll break down each method, show you where to mark the zones, explain entry and exit rules, and point out the common pitfalls. By the end you’ll have a toolbox you can apply on the 5‑minute, 15‑minute or hourly charts without guessing.
1. Order‑Block Liquidity Strategy , Capture Stop‑Loss Pools
Order blocks are clusters of institutional buy or sell orders that sit right where retail traders place their stops. When price revisits the block, the smart money often pulls liquidity to fill those orders, creating a sharp reversal. The first step is to locate the most recent bullish or bearish order block on a higher‑timeframe (daily or 4‑hour). Mark the block’s high and low with a rectangle; those levels become your potential entry zones.
On the lower‑timeframe (5‑minute or 1‑minute), watch for a quick price test of the block. A fast‑moving candle that pierces the block and then reverses with a long wick signals that the liquidity is being absorbed. Enter on the first candle that closes back inside the block, placing a stop just beyond the opposite side of the block. Take profit at the next major swing or at a risk‑reward of at least 1:2.
Why this works: Retail traders tend to set stops just beyond recent swing highs or lows. When a large institution wants to sell a lot of EUR, it pushes the price down to trigger those stops, then flips the market back up. By entering on the reversal, you ride the same move the institution creates.
Key considerations:
- Only trade blocks that have not been broken for at least one higher‑timeframe candle.
- Watch volume spikes on the block; a sudden rise confirms institutional interest.
- Avoid blocks that sit inside a strong trend; they are more likely to become continuation zones rather than reversal traps.
Risk management: Keep your stop just outside the block to protect against a false breakout. If the price breaks the block and stays beyond it, abandon the trade and wait for the next test.
Liquidity in finance is defined as the ability to quickly buy or sell an asset without moving its price Wikipedia. Understanding this definition helps you see why order blocks act as liquidity magnets.
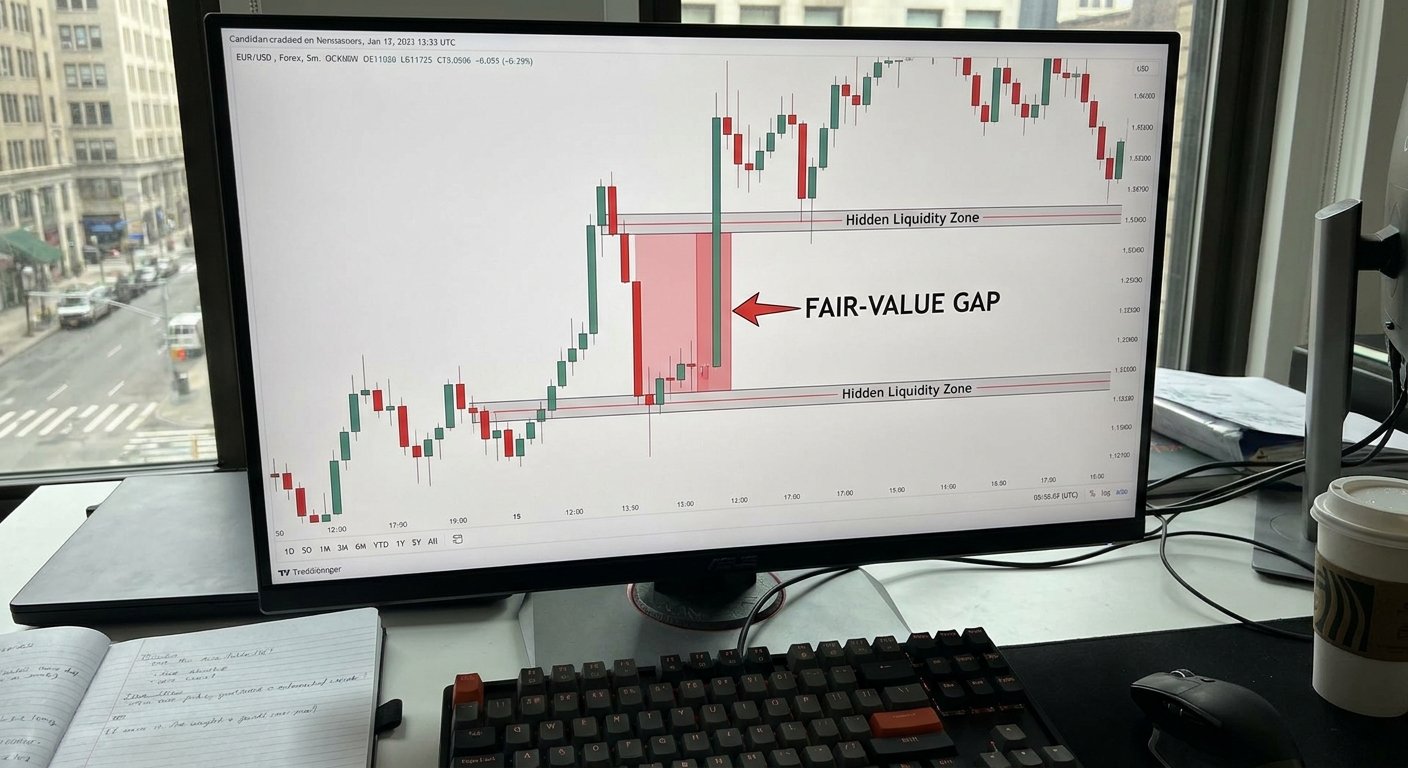
2. Fair‑Value Gap Sweep , Exploit Hidden Liquidity
A fair‑value gap (sometimes called a liquidity void) appears when price jumps over a range, leaving no trades in that zone. The gap creates a hidden pool of unfilled orders that the market will later try to fill, often causing a rapid reversal.
To spot a gap, zoom into a 5‑minute chart and look for two consecutive candles with no overlap in price. Highlight the empty space with a rectangle. The next time price re‑enters the gap, you’ll see an abrupt change in momentum: a small candle that spikes into the gap and then a larger candle that either breaks out or snaps back.
Entry rule: Place a pending buy order just above the bottom of a bullish gap, with a stop a few pips below the gap. For a bearish gap, reverse the setup. Aim for a 1:2 risk‑reward by targeting the next swing high or low.
Why it works: The gap represents a region where no traders were willing to trade. When price finally reaches that region, the market‑maker’s hidden orders are triggered, creating a quick price swing.
Usable tip: Combine the gap with a volume spike. If you see a sudden rise in volume as price approaches the gap, the probability of a fill increases dramatically.

Traders who ignore gaps often miss the most efficient entry points. By treating the gap as a magnet, you can align your trade with the market’s natural pull.
For a deeper look at how fair‑value gaps differ from regular price gaps, see FX Open’s analysis of liquidity voids. The article explains the mechanics and shows live examples.
3. Session‑Specific Liquidity Hunt , London & New York Opens
The London and New York sessions bring the most liquidity to the forex market. Large banks and hedge funds concentrate their order flow during these windows, which means stop‑loss pools swell dramatically.
To use this strategy, first mark the high and low of the previous day’s range on a 15‑minute chart. Then, note the exact time of the London open (8:00 AM GMT) and the New York open (1:00 PM GMT). As the session begins, watch for a rapid price move that tests the previous day’s range. If price spikes past the range and then quickly reverses, you’re likely seeing a liquidity sweep.
Enter on the reversal candle that closes back inside the range. Place a stop just beyond the extreme of the initial spike. Target the next major support or resistance level, often a few hundred pips away, depending on the pair’s volatility.
Why it works: Institutional traders often place bulk orders just beyond the prior day’s high or low to capture retail stop‑losses. When those orders are filled, the market often over‑extends and then snaps back toward the range.
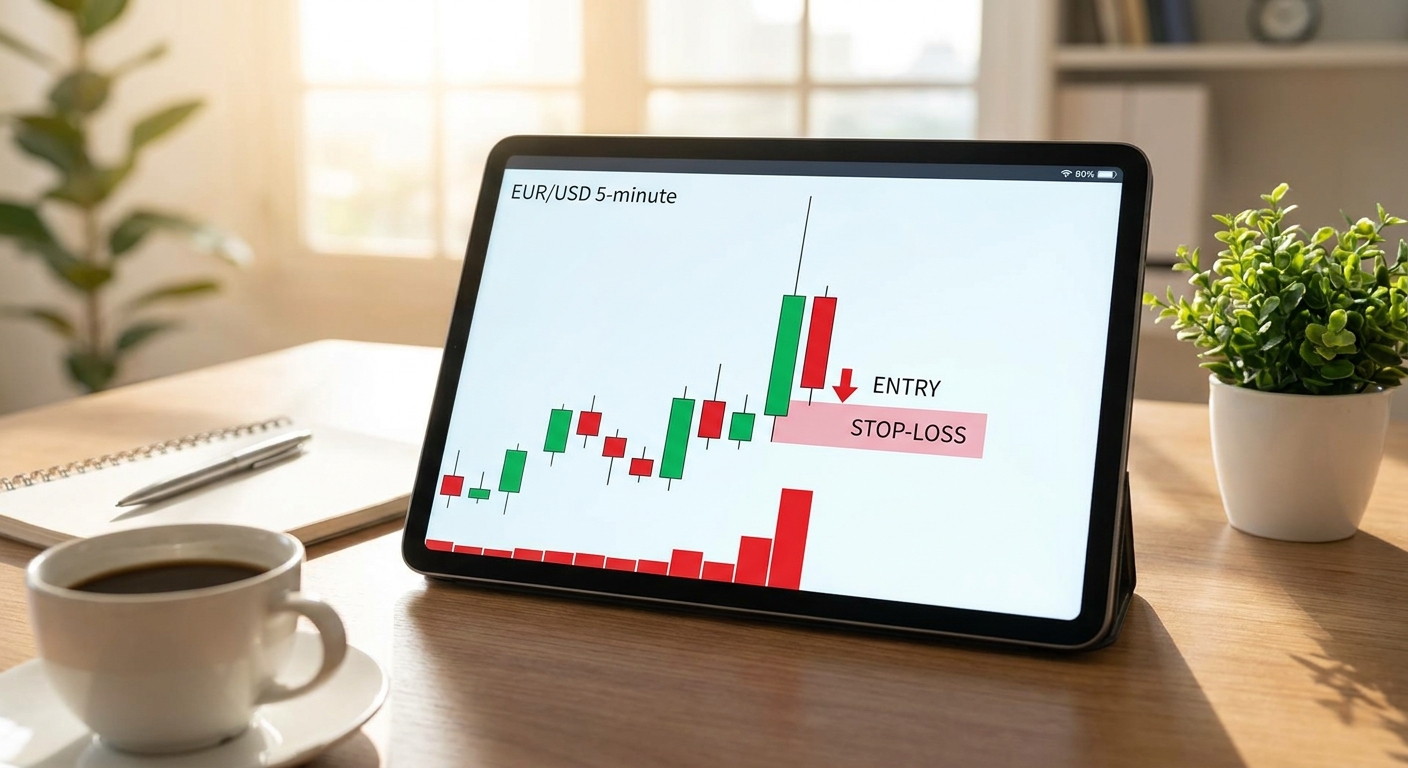
Example: On a EUR/USD 5‑minute chart, the price broke above the prior day’s high at the London open, then fell back 30 pips within two candles, providing a clean entry for a short trade.
For a systematic approach to session timing, see FX Doctor’s guide on forex automated trading strategies: a complete guide for 2026. It explains how to code session‑based filters into your platform.
4. Volume Spike & Wick Trap , Combine Candles with Liquidity
Volume spikes are the loudest shout that a big player is active. When a spike coincides with a long wick, it often means the market tried to push through a pool of stops but was repelled.
Steps:
- Set a volume indicator to highlight bars that are at least 1.5 times the average of the last 20 bars.
- When a high‑volume bar forms, look for a candle with a wick that exceeds the body by at least twice its size.
- Enter on the next candle that moves in the direction of the wick’s tail.
- Place a stop just beyond the high‑volume candle’s high (for longs) or low (for shorts).
- Target a risk‑reward of 1:2 by aiming for the next swing point.
Why it works: The long wick shows that price was pushed into a liquidity pool (retail stops) and then forced back, while the volume confirms that a large order was responsible.
Pro tip: Use a 20‑period simple moving average as a filter. Only take the setup when the price is above the SMA for longs, or below for shorts. This adds trend bias and improves win rate.
5. Dynamic Liquidity Cycle Play , Internal vs. External Flow
Liquidity isn’t static; it moves in cycles between internal (inside the current price range) and external (outside the range) pools. Understanding this rotation helps you anticipate where the market will head next.
Internal liquidity builds when price oscillates inside a range, creating small clusters of pending orders. External liquidity gathers at the range’s extremes , the highs and lows where many traders set stop orders. When price breaks out, it first hunts the nearest external pool, then uses internal liquidity to fuel the next leg.
How to trade the cycle:
- Identify the current range on a 30‑minute chart.
- Mark the internal high and low (the “fair‑price zone”).
- Watch for a breakout candle that moves toward an external extreme.
- If the breakout is accompanied by a volume surge, expect the market to fill the external pool and then reverse toward the internal zone.
- Enter on the reversal back into the internal zone, with a stop beyond the breakout extreme.
Risk tip: If the price continues beyond the external extreme for more than three candles, the market may be entering a new trend. In that case, treat the move as a breakout rather than a liquidity hunt.
6. Strategy Comparison Table
7. What to Look For When Choosing a Liquidity Strategy
Not every liquidity‑pool method fits every trader. Your choice should reflect your time horizon, risk tolerance, and the markets you trade.
Consider these factors:
- Time commitment:Order‑block and gap strategies work on short intraday charts, ideal for day traders. Session‑specific hunts need you to be online during the London or New York opens.
- Risk appetite:Volume‑spike setups often have tighter stops, which can feel aggressive. Dynamic‑cycle plays allow wider stops but require patience.
- Market condition:Ranging markets favor fair‑value gaps, while trending markets give more opportunities for order‑block reversals.
- Tool availability:You’ll need reliable volume data and a charting platform that lets you draw rectangles and annotate order blocks.
Test each method on a demo account first. Track win‑rate, average reward‑to‑risk, and drawdown. The strategy that consistently meets your performance criteria becomes your core.
Below is a short video that walks through setting up a dynamic liquidity‑cycle trade in a popular charting platform.
Conclusion
Liquidity pools are the secret sauce behind many of the sharp moves you see on forex charts. By learning how to spot order blocks, fair‑value gaps, session‑specific hunts, volume spikes, and the dynamic flow between internal and external pools, you give yourself a systematic edge over traders who rely only on price patterns.
Start by picking one of the strategies above, practice on a demo account, and record every trade in a journal. Over time you’ll see which method fits your style and risk tolerance best. When you’re ready to expand, check out FX Doctor’s deeper resources on automated trading and trade‑management to turn these concepts into a repeatable system.
Happy trading, and may the liquidity be ever in your favor.