
Imagine you’re staring at a EUR/USD chart on your laptop. The price has been moving up and down, but you can’t tell if it’s about to jump higher, slip lower, or just stay flat. You feel the urge to jump in, but you also know that a blind trade can wipe out your account fast. That’s the moment a solid free forex trading course can change the game. In this guide we’ll walk you through the basics of forex technical analysis for beginners, show you the tools you need, and give you a checklist you can use every day. By the end you’ll have a clear plan, not a guess.
We’ll start with market structure – the way price makes highs and lows. Then we’ll look at the core indicators that help you spot trends. After that we’ll dive into price‑action, support, resistance, and candlesticks. You’ll get a step‑by‑step checklist (with a handy table) and learn how to tie risk management into your analysis. Finally we’ll wrap up with a short FAQ. Let’s get rolling.
Understanding Market Structure and Trend Identification
Forex technical analysis for beginners begins with reading the market’s shape. Price doesn’t move randomly; it creates patterns of higher highs, higher lows, lower highs, and lower lows. Those patterns tell you if the market is trending up, down, or ranging.
Here’s what you should look for:
- Higher Highs (HH) and Higher Lows (HL): the hallmark of an uptrend.
- Lower Highs (LH) and Lower Lows (LL): signals a downtrend.
- Side‑by‑side highs and lows: a sign of a range.
Why does this matter? Knowing the trend lets you trade with the market, not against it. If the trend is up, you’ll look for long entries near support. If it’s down, you’ll look for short entries near resistance.
How to spot the trend on a chart? Use a simple line that connects swing highs or lows. The line should slope upward for a bullish market and downward for a bearish market. Keep the line short – just a few bars – so it stays relevant.
Let’s say EUR/USD makes a series of higher lows at 1.0800, 1.0850, and 1.0900 while the highs climb to 1.0950, 1.1000, and 1.1050. That pattern tells you the market is in a clear uptrend. You could then set a buy order near the latest low, 1.0900, with a stop just below 1.0850.
Trend identification isn’t perfect. Markets can switch quickly, especially around news events. That’s why you should always confirm the trend with an indicator. Two reliable tools are the Fidelity chart‑pattern guide and a simple moving average (SMA). The SMA smooths out noise; when price stays above the SMA, the trend is up, and vice‑versa.
Actionable tips:
- Mark swing highs and lows on your chart each day.
- Draw a trend line that connects at least three points.
- Check that price stays on the right side of a 20‑period SMA before you trust the trend.
Core Technical Indicators Every Beginner Should Know
Forex technical analysis for beginners gets a boost from a few key indicators. They turn raw price data into signals you can act on.
Moving Averages
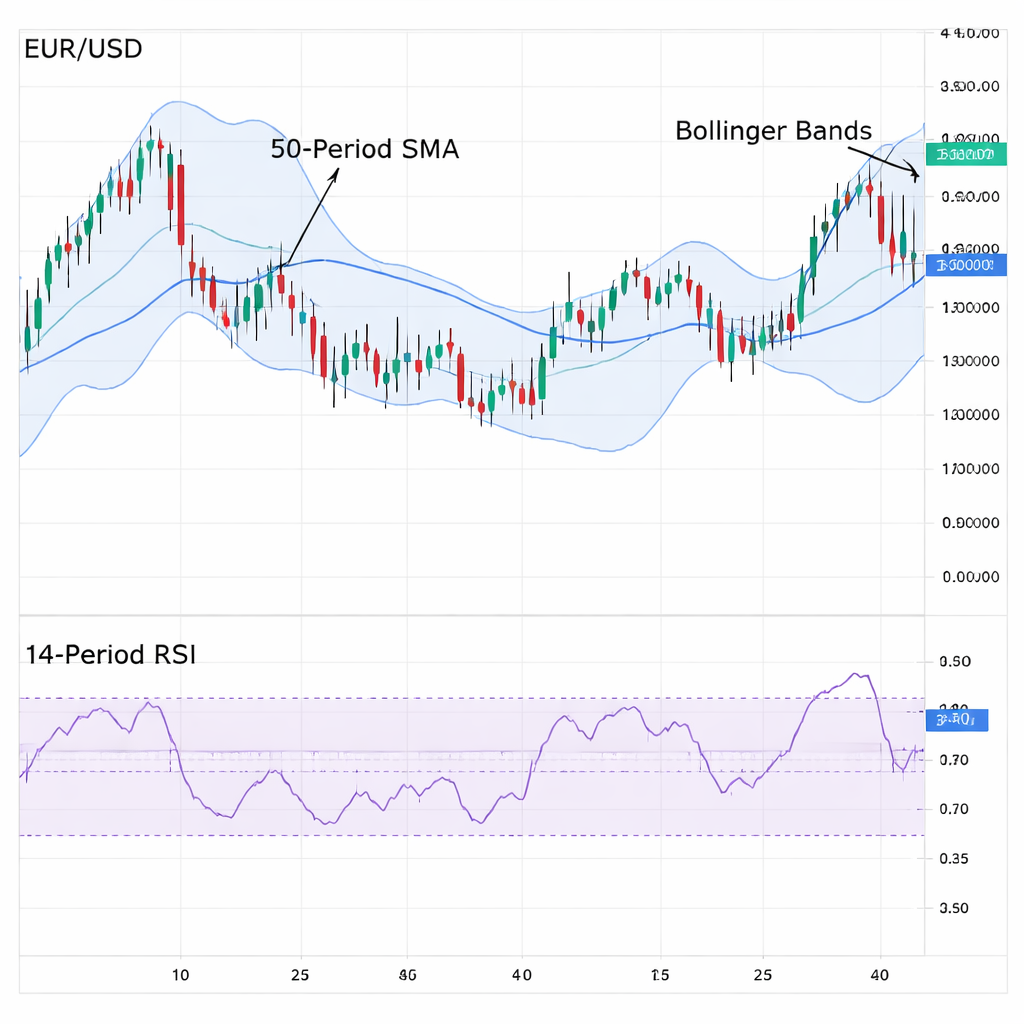
Moving averages (MA) smooth out price. The most common are the Simple Moving Average (SMA) and Exponential Moving Average (EMA). A 50‑period SMA shows the medium‑term trend, while a 200‑period SMA shows the long‑term trend.
How to use them:
- Plot a 50‑period SMA on a 1‑hour chart.
- When price crosses above the SMA, look for a long entry.
- When price crosses below, look for a short entry.
Combine a short‑term EMA (like 9‑period) with a longer SMA to catch early moves.
Relative Strength Index (RSI)
The RSI measures momentum on a 0‑100 scale. Readings above 70 hint at overbought conditions; below 30 hint at oversold.
Example: If EUR/USD’s RSI hits 78, the pair may be due for a pullback. You could plan a short entry near a resistance level.
Bollinger Bands
Bollinger Bands place a moving average in the middle with two bands set two standard deviations away. When price touches the upper band, it may be overbought; touching the lower band may be oversold.
Tip: Watch for a “squeeze” where the bands narrow. A squeeze often precedes a breakout.
Why these three? They each give a different view – trend (MA), momentum (RSI), and volatility (Bollinger). Using them together avoids over‑reliance on one signal.
Actionable checklist for indicators:
- Set a 50‑period SMA on your main chart.
- Add a 14‑period RSI and watch for 70/30 thresholds.
- Overlay Bollinger Bands (20‑period, 2‑std).
- Only act when at least two of the three agree.
For a visual example, see the chart below.
Reading Price Action – Support, Resistance, and Candlestick Patterns
Forex technical analysis for beginners isn’t just about numbers. It’s about reading the story the price tells.
Support and Resistance
Support is a level where price has bounced up before. Resistance is where price has fallen back down. These levels act like walls.
To find them, look for areas where the price has turned at least twice. Draw a horizontal line at that level. The more times price respects the line, the stronger it is.
Example: If GBP/JPY repeatedly bounces off 150.00, that’s a support zone. You could set a buy order just above 150.00 and a stop just below.
Candlestick Patterns
Candlesticks show the open, high, low, and close for each period. Certain shapes hint at future moves.
- Doji: Open and close are almost equal. Signals indecision.
- Hammer: Small body, long lower wick. Shows buyers stepping in after a drop.
- Engulfing: A large candle fully covers the previous one. Indicates a possible reversal.
Combine a pattern with a support or resistance level for stronger signals. For instance, a bullish engulfing candle at a support zone often means the price will rise.
Let’s say USD/CAD is dropping toward a known support at 1.2500. You see a hammer candle forming right at that line. That’s a cue to go long, with a stop just below the low of the hammer.
Why does this work? The market respects the wall (support) and the candle shows buyers are stepping in. Together they give you a higher‑probability trade.
Actionable tips:
- Mark at least two support and two resistance levels on each chart.
- Watch for Doji, Hammer, and Engulfing patterns near those levels.
- Confirm the pattern with an indicator like RSI (e.g., oversold at 30 for a bullish reversal).
And here’s a quick video that walks through spotting these patterns in real time.
Building a Simple Technical Analysis Checklist (Table Included)
Even the best trader can slip up if they skip a step. A checklist locks in good habits and filters out bad trades. Below is a concise list you can copy and paste into a notebook.
Before you start, think about this: a well‑written checklist is like a safety net. It catches mistakes before they cost you money.
Here’s the checklist broken into steps:
- Check account health: free margin, balance, open positions.
- Identify market structure: trend line, HH/HL or LL/LH.
- Mark key support and resistance zones.
- Apply core indicators: SMA, RSI, Bollinger Bands.
- Look for price‑action signals: candlestick patterns at zones.
- Set risk‑reward: aim for at least 1:2 ratio.
- Determine position size: risk 1‑2% of account.
- Write entry, stop, and target levels.
- Do a final review: does everything match your plan?
For a quick visual, see the table that groups the steps.
| Step | What to Do | Why It Matters |
|---|---|---|
| 1 | Check account health | Prevents margin calls and over‑exposure. |
| 2 | Identify market structure | Shows you the prevailing trend. |
| 3 | Mark support/resistance | Finds likely bounce or break points. |
| 4 | Apply indicators | Confirms trend and momentum. |
| 5 | Spot price‑action | Gives entry cues at key zones. |
| 6 | Set risk‑reward | Ensures profitable trades beat losses. |
| 7 | Determine size | Keeps risk per trade low. |
| 8 | Write entry/stop/target | Prevents impulsive changes. |
| 9 | Final review | Double‑checks everything aligns. |
Now add a few external resources that help you flesh out each step.
- LiteFinance trading checklist guide
- More on building solid checklists
And a quick link to a related idea outside forex: Photo Booth Rental Murrieta: A Complete Guide for 2026 Events. While not about trading, the same planning mindset applies – you set up a plan, check each step, then enjoy the event.
Integrating Risk Management with Technical Analysis
Forex technical analysis for beginners is only half the story. Without risk management, even the best analysis can lead to big losses.
Set a Risk‑Reward Ratio
Before you enter a trade, decide how much you’ll risk and what reward you expect. A common benchmark is 1:2 – risk $1 to make $2. This means even if you win only half your trades, you still profit.
To calculate, look at the distance from entry to stop (risk) and entry to target (reward). If the stop is 30 pips away and the target is 60 pips away, you have a 1:2 ratio.
Position Sizing
Never risk more than a small slice of your account on any trade. A rule of thumb is 1‑2% of equity per trade. Use the formula:
Risk per trade = Account equity × risk %.
Then divide that risk amount by the pip risk to get the lot size.
Use Stops and Limits
Stops protect you if the market moves against you. Place them just beyond a key level – for a long trade, a few pips below a support zone; for a short trade, a few pips above resistance.
Limits (take‑profits) lock in gains when price hits your target. Setting them early removes emotion from the exit.
Leverage Awareness
Forex lets you trade with leverage, which magnifies both gains and losses. If you use 20:1 leverage, a 5% move can erase your whole margin. Keep leverage low until you’re confident in your analysis.
Actionable risk‑management steps:
- Define risk‑reward before you trade.
- Calculate lot size using a 1‑2% risk rule.
- Set stop loss just beyond the nearest support/resistance.
- Set take‑profit at a level that meets your risk‑reward goal.
- Review your margin and leverage daily.
External references for deeper reading:
- IG risk‑management guide
- More on risk tools from IG
Remember: Good risk management turns a series of small wins into a sustainable career.
Conclusion
We’ve walked through the core of forex technical analysis for beginners. You now know how to read market structure, use moving averages, RSI, and Bollinger Bands, spot price‑action cues, and follow a step‑by‑step checklist. You also have a clear view of how risk management fits into every trade. Put these pieces together, practice on a demo account, and you’ll build confidence without risking real money.
Keep the checklist handy, review each trade, and stay disciplined. The journey to consistent trading is a marathon, not a sprint. If you want a deeper dive into each topic, check out the Free Forex Trading Course: A Complete Beginner’s Guide on FX Doctor. Happy charting, and trade safe.
FAQ
What is the first step in forex technical analysis for beginners?
The first step is to understand market structure. Look for higher highs and higher lows in an uptrend, or lower highs and lower lows in a downtrend. Mark these points on your chart, draw trend lines, and confirm with a simple moving average. This gives you a clear picture of the prevailing direction before you add any indicators.
How do I choose which indicators to use?
Start with three basics: a moving average for trend, RSI for momentum, and Bollinger Bands for volatility. Use the 50‑period SMA to see the medium trend, the 14‑period RSI to spot overbought or oversold zones, and 20‑period Bollinger Bands to catch squeezes. When at least two of them agree, you have a stronger signal.
What are the most reliable candlestick patterns for beginners?
The most reliable patterns are the Doji, Hammer, and Engulfing. A Doji shows indecision, a Hammer shows buying pressure after a drop, and an Engulfing candle shows a clear reversal. Look for these patterns near support or resistance zones for the best odds.
How can I create a daily trading routine?
Begin each day by checking your account balance, free margin, and any open trades. Then scan for market structure, mark key support and resistance, apply your three core indicators, and look for price‑action cues. Finish with a final checklist review before you press “enter.” This routine keeps you disciplined and reduces impulsive decisions.
What risk‑reward ratio should I aim for?
Aiming for at least a 1:2 risk‑reward ratio is a solid rule. That means you risk one unit of capital to potentially gain two. To set it, measure the distance from your entry to the stop loss (risk) and from entry to the target (reward). If the reward is at least twice the risk, the trade meets the rule.
How does leverage affect my risk management?
Leverage lets you control a larger position with a smaller deposit, but it also magnifies losses. If you use high leverage, a small adverse move can wipe out your margin. Keep leverage low while you’re learning, and always calculate your lot size based on a 1‑2% risk of your account equity.
Why is a trading checklist important?
A checklist forces you to follow a logical process each time you trade. It helps you verify that the market structure, support/resistance, indicator signals, and risk‑reward all line up. By checking each step, you avoid impulsive trades and keep emotions out of the equation, which is key for long‑term success.
Where can I find more resources on forex technical analysis for beginners?
You can explore the FX Doctor blog for more guides, such as the Forex Trading Tutorial: From Beginner Concepts to Advanced Techniques. Additionally, external sites like the Fidelity chart‑pattern PDF and IG’s risk‑management page offer solid, free material to deepen your knowledge.