
Every serious trader knows that the market is a conversation – it speaks in price ticks, trend lines, and the subtle flickers of volatility. But like any good conversation, the real insight comes from what you write down afterward.
Ever wonder why some traders feel like they’re riding a rollercoaster while others sit calmly on a steady track?
It’s not about luck; it’s about a disciplined log that turns every trade into a learning loop.
Imagine having a single, ready‑made framework that captures entry, exit, emotion, and hindsight all in one neat sheet.
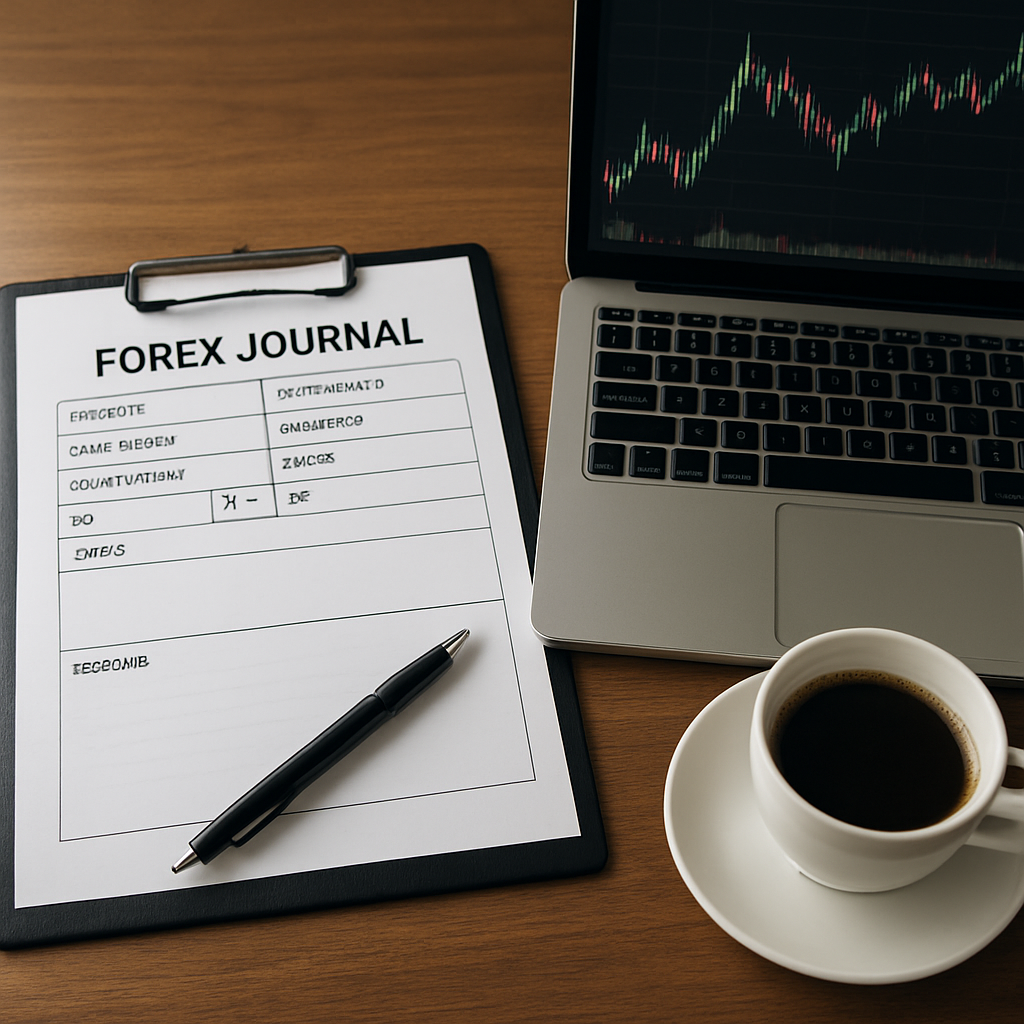
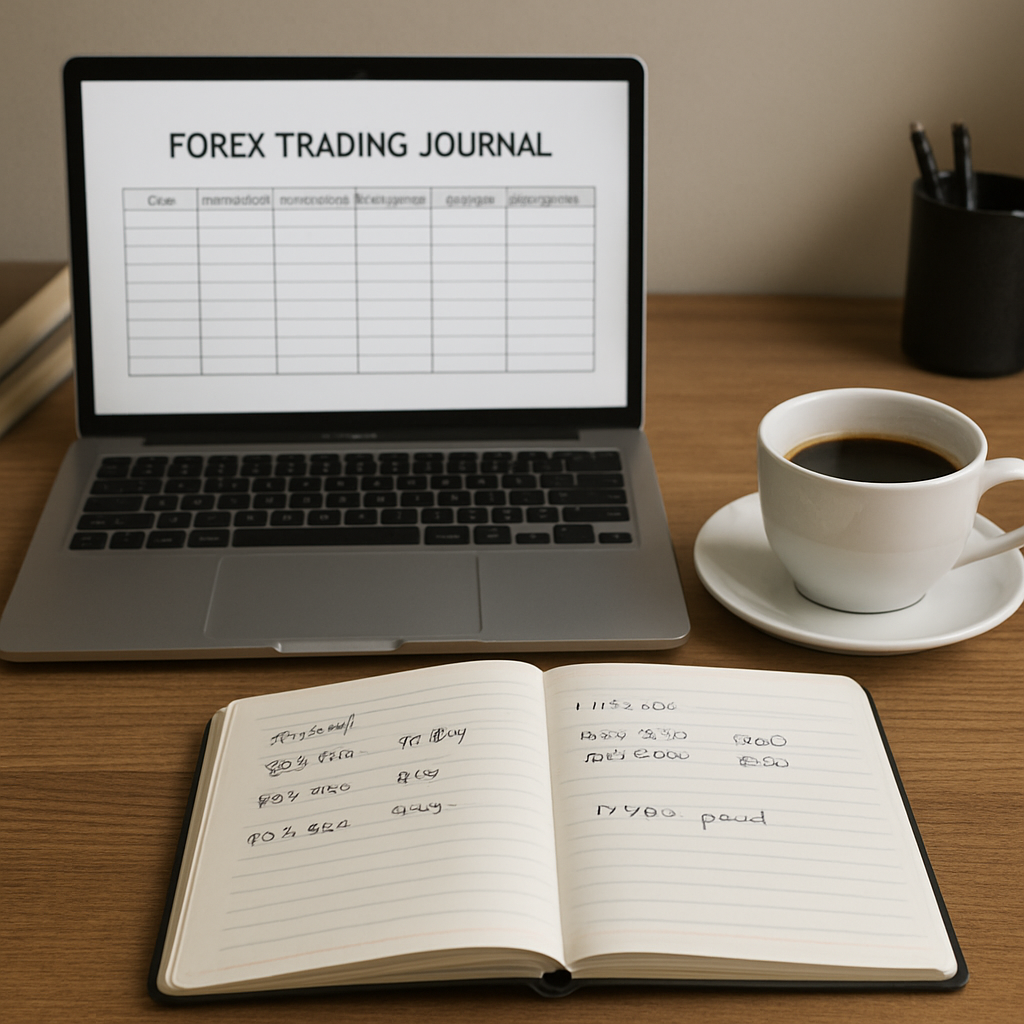
A forex trading journal template does more than store data; it forces you to question assumptions, spot patterns, and refine strategy.
If you’re starting out, our Forex Trading Plan Template walks you through every section, from setting stop‑losses to noting market sentiment.
For instance, after closing a 0.5 pip win on GBPUSD, you jot the trade’s rationale, the chart pattern you used, and how the news event influenced price.
Step one: set a dedicated sheet for each currency pair. Keep the columns consistent so you can compare months at a glance.
Step two: add an “emotions” column. Noticing whether you were nervous or overconfident can be the difference between a habit and a mistake.
To keep everything organized and searchable, you might consider a digital tool like Yaranga, a simple task‑based note‑taking app that scales with your trading rhythm.
Checklist to launch: 1) decide your timeframe, 2) list entry triggers, 3) record outcomes, 4) review weekly, 5) tweak based on evidence.
With a journal in hand, the market stops being a mystery and starts becoming a predictable, repeatable practice you can own.
Remember, consistency beats perfection; even a half‑filled journal is better than an empty one because it forces reflection and continuous improvement.
Start now; the first entry matters today.
TL;DR
A forex trading journal template turns every entry into a learning checkpoint, helping you spot patterns, test ideas, and adjust risk without guesswork. Start with a clean sheet for each pair, log emotions, and review weekly to keep the practice disciplined and data‑driven for lasting growth and sharper insight today.
Step 1: Define the Purpose of Your Journal
Let’s be honest: the most powerful trading tool isn’t a flashy indicator or a secret strategy. It’s a journal with a clear purpose you can act on. Step 1 is about naming that purpose so every entry moves you forward.
And if you skip this, you’ll end up chasing noise instead of learning. A purpose acts like a compass in the whirlwind of price moves, helping you decide what to log and what to ignore.
Think about what you want to understand by week’s end. Are you trying to see how often you misread pullbacks, or how news shaped moves? Write down 2–3 concrete goals you can measure in your journal.
Your goals determine your pages. For a beginner, log setup, entry rationale, stop placement, and outcome. For psychology-focused traders, track emotions, confidence, and fatigue.
Create a simple one‑page template you fill after every trade. Date, currency pair, timeframe, setup, entry, exit, risk-per-trade, result, and a takeaway.
Add an ’emotions’ section—not to wallow, but to spot patterns: nervous before breakouts, overconfidence after a win, relief after a close call.
Here’s a quick explainer to anchor ideas in practice.
Does this approach feel doable? It does when you keep it simple and repeatable.
With purpose defined, your next step is to practice consistency: log every trade for a week, then review.
Consistency beats brilliance in a noisy market. A clear purpose helps you separate patterns from random outcomes.
Start by drafting your 1-page template today, then commit to filling it after every trade this week.
If you do, you’ll start seeing the kinds of patterns that used to hide in the noise.
What to do next after you finish the week log? Set a weekly review ritual: mark patterns, evaluate if goals were realistic, adjust your template accordingly.
Pull ideas from your notes and craft a tiny improvement plan: tweak a column, add a column for risk notes, or experiment with different timeframes.
<p and="" consistency="" goal="" isn’t="" it’s="" learning="" on="" p="" perfection;="" remember,="" terms.
If you stick with this for 30 days, you’ll have a real map of how you think, where you trip, and what actually moves your edge.
Now imagine your desk: a tidy notebook, a chart on screen, a coffee ring, and a plan that finally makes your decisions feel deliberate.
That’s the power of a purpose-driven forex trading journal template.
Take five minutes tonight to write your initial purpose sentence: ‘I want to understand [X] this week, log [Y], and improve [Z].’ Then start the week, and be ready to learn.
We’ll circle back after the first review to tighten things.
Step 2: Capture Trade Details with Precision
Now that you’ve set a purpose, it’s time to put that intention into action. The first thing to do is capture the raw data of each trade as soon as it closes. Think of this step as the heart of your journal – if the data’s missing, the rest of the analysis loses its rhythm.
Why Details Matter
Every price move you log becomes a piece of evidence that can confirm or challenge your trading theory. A single line about “entered at 1.3050” paired with a note on the market sentiment that day turns a simple record into a learning tool.
Key Columns to Capture
- Date & Time: The exact moment when the trade closed. Even a few minutes can change the context.
- Pair & Direction: Which currency pair you traded and whether you were long or short.
- Entry, Target, Stop: The three pillars of every trade. Include the price levels, not just the rationale.
- Position Size: How many lots or units you used, so you can later calculate risk and reward.
- Outcome & P&L: Whether the trade hit the target, hit the stop, or closed at a manual exit. Add the profit or loss in pips or dollars.
- Emotions: A quick phrase like “nervous at break‑out” or “confident after candle confirmation.”
- Post‑Trade Reflection: One or two sentences that ask, “What worked?” or “What surprised me?”
Timing Is Everything
You’ve seen the video that walks through a live trade session. After each close, pause the screen, grab a pen or a note app, and jot down the details. If you wait, you’ll lose the subtle feelings and market context that only you remember in the moment. Watch this helpful video to see how fast you can capture the essential data.
Build a Template That Fits Your Style
Most beginners start with a simple table. If you’re using Google Sheets, create a row per trade and freeze the header. Color the outcome cells – green for wins, red for losses – to spot patterns at a glance. For advanced traders, add columns for indicators (e.g., RSI, EMA crossover) or time‑frame confluence.
Practical Tips for Consistency
- Set a reminder: Your phone’s alarm can go off right after market close to prompt you to log.
- Keep it short: Aim for one sentence per entry. If you need more detail, add a note in a separate column later.
- Review weekly: Every Friday, flip through the week’s entries and spot one theme – maybe you’re too aggressive on the 1‑hour chart.
- Use a mobile app: If you’re trading on the go, a note app that syncs with your computer keeps the journal in one place.
By capturing each trade with precision, you’re not just logging numbers; you’re creating a data set that will reveal the habits that help you win and the blind spots that cost you. Keep the process quick, keep it honest, and let the journal become a trusted partner in your trading journey. Remember, the next trade is just an opportunity to add another data point to your evolving story.
Step 3: Track Key Metrics to Measure Performance
Let’s be blunt: numbers don’t lie. If you want real progress, you need to measure the right things, not just your P&L.
In our experience, turning every trade into a small set of metrics is the fastest way to improve consistency.
So let’s set a practical framework you can start using today.
Core metrics to track
Start with a few core ideas that tell you whether your edge is real and whether you’re respecting your plan.
- Reward-to-risk ratio (R:R): the potential reward divided by the risk you take. A setup that offers 2:1, for example, means you stand to gain twice as much as you risk. Track this for every trade and aim for a reasonable average rather than chasing huge single trades.
- Win rate: the percentage of winning trades. Don’t chase a high number at the expense of risk or reward; a decent win rate plus solid risk management is what matters.
- Profit factor: gross profits divided by gross losses. A value above 1 is good, but you want it to move higher as your edge improves.
- Maximum drawdown (MDD) and recovery factor: how much you could be down during a bad run and how quickly you recover. These tell you about risk tolerance and resilience in real-market stress.
- Expectancy: the average expected P&L per trade, accounting for both winners and losers. It answers whether your system, on balance, adds up to profit over time.
These metrics give you a compass. They’re not just numbers; they’re signals about how well you’re following your plan and how your psychology holds up under pressure.
For a deeper dive on which stats matter and how to interpret them, check out Babypips’ guide on trader stats you should track and, separately, the detailed performance analysis framework in the FBS article on assessing forex trading performance. Both offer practical perspectives you can actually apply in a real journal.
In our experience, set your defaults in a simple journal layout. For example, create a row per trade with fields like Date, Pair, Direction, Entry, Exit, Stop, Target, Size, P&L, R:R, and a short Reflection. Then add computed columns for R:R averages, win rate, and a rolling MDD to spot trends over time.
Step-by-step, here’s how to implement quickly:
- Choose your core metrics (R:R, win rate, MDD, expectancy) and write the exact definitions in the header of your sheet.
- Build a one-row-per-trade template with fields for data you actually record after each trade.
- Enter a few trades and calculate the ratios using simple formulas. For long trades, Reward = Target − Entry and Risk = Entry − Stop; for short trades, use the reverse.
- Compute running averages and the overall win rate, then compare against your plan’s expectations.
- Review weekly. Look for patterns—are your losses clustered around breakouts, or during news events? Use those insights to adjust position sizes or triggers.
Does this really work? It does when you keep it honest and consistent. The data should push you toward fewer but higher-quality setups and more disciplined risk care.
Bottom line: tracking the right metrics turns a trading journal from a log into a learning machine. If you want a ready-made starting point, a simple template aligned with the concepts above is a solid first step.
Step 4: Compare Journal Formats – Spreadsheet, Paper, or App
Let’s cut to it: the format you choose shape how quickly you’ll learn and how reliably you’ll pull insights from your forex trading journal template. The right fit depends on how you trade, what you want to measure, and how you like to review data.
Spreadsheet templates give you maximum control. You can customize columns, create formulas, and see metrics unfold in real time. For a forex trading journal template, that means easy tracking of entries, R:R, win rate, and even rolling drawdowns. The downside? you’ve gotta be consistent about data entry and you’ll spend a bit more time building and maintaining the sheet. If you’re starting out and want a clear, low-friction path, this is a solid first step. digital journaling options can make this even simpler if you want to explore a digital approach later.
Paper journals feel tangible and fast for jotting quick reflections or emotions right after a trade. They reduce screen fatigue and keep your mind focused on the decision moment. But they’re not ideal if you want automatic analysis or cross‑device access. If your goal is discipline and honest reflection more than data crunching, paper can be surprisingly effective for developing the habit of recording the rationale and outcomes.
Apps and dedicated journaling software blend the benefits of both worlds. They offer templates, cloud sync, quick search, and built‑in analytics that can show you how your trades stack up over weeks and months. They’re particularly helpful for traders who manage multiple currency pairs and need one place to store entries, emotions, and post‑trade reflections. If you’re aiming for a scalable system that grows with you, this is often the strongest long‑term choice. And yes, you can still export data to a spreadsheet if you want to run custom calculations later.
So, what should you do next? Ask yourself these questions: Do you want automatic imports from your broker? Do you need charts and performance dashboards to spot patterns quickly? Are you comfortable paying for a tool, or do you prefer a free, DIY approach?
Here’s how to decide based on common trader profiles:
- Aspiring traders: start with a simple spreadsheet or a pocket notebook to build the habit of logging every trade and the rationale behind it. As you grow, you can migrate to digital templates with basic metrics.
- Experienced traders seeking consistency: a digital journal with templates and analytics helps you quantify edge and risk, and cross‑check decisions across sessions and timeframes.
- Individuals developing a personalized system: mix formats. Use a spreadsheet for core data and an app for quick reflections and easy review on the go.
Implementation steps, in short:
- Pick one format to start. Commit to a 4‑week trial.
- Set up core fields: Date, Pair, Direction, Entry, Target, Stop, Size, P&L, R:R, Emotions, Reflection.
- Test data flow: enter trades consistently, then review weekly for patterns.
- Decide whether to scale up to a more advanced app or keep expanding your spreadsheet with additional metrics.
One more thing: FX Doctor recognizes that every trader learns differently. If you’re leaning toward a blended approach, you can start with a simple spreadsheet and move to an app as your needs grow. Our aim here is to give you a practical, low‑risk path to turning a forex trading journal template into a learning machine that guides better decisions over time.
| Format | Pros | Cons | Best For |
|---|---|---|---|
| Spreadsheet | Highly customizable; low cost; easy to share | Manual data entry; potential for formula errors | Aspiring to intermediate traders who want control |
| Paper Journal | Low distraction; fast for notes; great habit builder | No automatic analytics; hard to aggregate data | Traders focusing on discipline and reflection |
| App/Dedicated Journal | Auto imports, dashboards, cross‑device access | Cost; learning curve; reliance on tech | Experienced to advanced traders seeking scalable analytics |
Step 5: Leverage Your Journal for Risk Management
Let’s be honest: risk management isn’t sexy, but it’s the guardrail that keeps you in the game. Your forex trading journal template should become the place you formalize risk rules, then measure whether you actually stick to them. When you see how often you deviate, you can fix it before the next trade. This is where real progress happens.
Reconfirm your risk per trade and your overall tolerance. If you’re trading this week, your journal should hold a clear rule: what you’re willing to risk on a single setup, and how you adjust size when a setup looks favorable or unfavorable. In practice, your forex trading journal template should have a field for “Risk per Trade” and a calculation for position size so you can see the math behind the order you place.
Track risk alongside rewards
Log both the risk you took and the profit or loss you earned. Look for patterns like: do your biggest losses come from a few wide stops, or from letting winners turn into pullbacks? Add a “Risk Taken” column and a “Drawdown Impact” note to your forex trading journal template. When you see a week of red, you’ll know right away whether the issue is position sizing, stop placement, or entry timing.
Key risk patterns to watch
First, overexposure. You hit a strong breakout and immediately push size up, only to see volatility spike and your max drawdown jump. Second, over-correction. After two straight losses, you shrink risk too aggressively and miss a legitimate setup. Third, neglecting stops in fast markets. The result is slippage and bigger-than-expected losses. Your journal will surface these patterns if you log both the trade outcome and the risk discipline you followed.
Practical steps you can implement today
- Set a firm risk-per-trade rule. Decide the percentage or dollar amount you’ll risk, and enter it in the forex trading journal template before you place the trade.
- Calculate size from risk. Use Size = Risk per Trade / (Entry price − Stop price) to keep sizing consistent with your plan. This keeps you honest about potential loss.
- Log adherence after every trade. Note whether you followed your risk plan and what you’d adjust next time.
- Implement a weekly risk review. Every Friday, scan the week’s trades for drawdown spikes, then adjust position sizing or stop distances if needed.
- Use a drawdown threshold. If your rolling max drawdown breaches a limit, reduce exposure for a set period and re-check your plan.
Key risk metrics to watch
Use the forex trading journal template to calculate the maximum drawdown (MDD), the recovery factor (how fast you bounce back after a drawdown), and risk-adjusted performance per trade. These metrics aren’t about chasing perfection; they’re about ensuring you don’t tolerate unreasonably large losses for the chance of small gains. Track these weekly to see if your edge is robust or simply volatile folklore.
Real-world examples you can relate to
Imagine you’ve had a string of small wins, then a single bigger loss. If your journal shows you kept risk constant, you likely avoided a bigger crisis. Now imagine a week where you cut risk after two losses, but one of the new positions still stretches into your stop range. Your journal will highlight whether that adjustment helped or hurt future performance, guiding better tweaks next time.
Make it a habit
So, what’s the practical finish line? Build the habit. Before you trade, confirm your risk rules are wired into the forex trading journal template. After you close, log exactly what you did with risk, then spend 10–15 minutes on a quick weekly risk review. The payoff isn’t flashy, but it’s real: steadier drawdowns, more consistent growth, and less emotional guessing when markets get wild.
FX Doctor emphasizes disciplined risk practices in our educational materials. A well‑designed forex trading journal template isn’t just a record; it’s a tool to protect your capital and sharpen your decisions over time.
Start today: set your weekly risk target, log it, and review what actually happened. Tiny, consistent steps here compound into meaningful resilience in the long run.
Step 6: Refine and Adapt Your Template Over Time
You’ve built a solid forex trading journal template. Now the real work starts: refining it so it grows with your skills and stays relevant in 2026. A template that never evolves becomes a brittle tool that collects dust instead of data.
Think of your journal as a living document. It should adapt as you learn, not lock you into a static checklist. So, what does steady evolution look like? It begins with a plan you can actually follow.
Start with a growth plan
Outline a 90‑day path for expanding your fields. Start with the basics—Date, Pair, Direction, Entry, Exit, Stop, Target, Size, P&L, and a brief Reflection. After a month, add Emotions and Post‑Trade Reflection if you haven’t yet. At the 60‑ to 90‑day mark, bring in R:R, win rate, and a simple drawdown line to track resilience.
Upgrade data capture gradually
As you gain clarity, introduce context‑specific fields. Examples: market conditions (trend strength, volatility), time frame confluence (1H + 4H alignment), and notes on news events. The goal isn’t to overwhelm you, but to give you richer signals to study. Keep the core dataset stable so your trend analyses aren’t disrupted by constant schema changes.
Automate where possible
Automation reduces grind and unlocks real‑time insights. If you’re ready to scale, consider tools like Tradervue trading journal template or Trademetria’s online journal template to import trades, compute metrics, and generate dashboards. Tradervue, for instance, offers automated journaling and reports that help you spot patterns you’d miss in a spreadsheet. Trademetria provides online templates and analytics to surface daily habits and decision‑making trends.
These platforms aren’t magic; they’re a way to shift from manual data entry to data‑driven review. They let you see which setups consistently work and where your discipline breaks down, without drowning in numbers.
Quarterly review ritual
Put a light, repeatable cadence around it. Do a quick weekly minireview, then a deeper quarterly pass. Here are practical steps you can take now:
- Review your top 20% of trades and extract the common factors that powered wins.
- Check risk rules adherence—did you follow your plan on size, stops, and timing?
- Identify one concrete improvement to test in the next quarter and document it in the template.
- Export a small report (even a csv) so you can see trends without wading through raw data.
Does this feel doable? It is. Start today by adding one new field and trying one automation hookup this week.
FAQ
1. What exactly is a forex trading journal template?
A template is a ready‑made grid or form that you fill out after each trade. It usually includes columns for date, pair, direction, entry, target, stop, size, profit‑loss, risk‑reward, and a brief reflection. Think of it as a notebook that forces you to record the same data every time, so patterns emerge instead of random memories.
2. Why should I bother with a journal instead of just tracking P&L in a spreadsheet?
Tracking numbers alone tells you if you’re winning, not why. A journal forces you to note the logic behind each move, the market context, and your emotions. Over time you’ll see which setups work, which rules you skip, and which feelings lead to slippage. That insight is the real engine that turns experience into skill.
3. Can I start with a simple spreadsheet or do I need specialized software?
You can begin with a basic Google Sheet or Excel file. The key is consistency: same columns, same data, every trade. As you grow, you might move to a dedicated platform that imports broker data, auto‑calculates metrics, and gives dashboards. But the spreadsheet is a low‑cost, highly customizable foundation for beginners.
4. How often should I review the journal to see meaningful trends?
Short‑term reviews are best done weekly. Flip through the past seven trades, spot one common theme, and jot it down. Quarterly reviews dive deeper: calculate win‑rate, average R:R, and drawdown. The combination of micro‑and macro‑view keeps the journal actionable without becoming a chore.
5. What are the must‑have columns for an effective template?
At minimum: Date, Pair, Direction, Entry, Target, Stop, Position Size, P&L, R:R, and a “Reflection” field. Many traders add a quick “Emotion” tag—like “nervous” or “confident.” This single extra tag turns a data sheet into a psychological map that informs future decisions.
6. How can I use the journal to improve risk management?
Include a “Risk per Trade” column and compute Position Size = Risk ÷ (Entry–Stop). After each trade note whether the rule was followed. At the end of each week, check the ratio of risk taken versus profit gained. If you see a trend of over‑exposure during breakouts, tighten your stop distance or adjust sizing until the numbers align.
7. What if I get lost in the details and forget to fill entries?
Create a habit trigger: set a phone alarm right after market close or log the trade the first time you see the closing price. Keep the template short—one or two sentences per reflection—and make the form mobile‑friendly. Over time the routine will feel natural, and you’ll be less tempted to skip the log.
Conclusion
Let’s pull all the threads together.
The forex trading journal template is more than a spreadsheet; it’s your personal coach.
By capturing dates, pairs, entry, stop, target, risk and a quick emotion tag, you get a clear picture of what works.
The magic happens when you review the same data week after week; patterns that were invisible turn into actionable insights.
For beginners, keep the template simple—one row per trade, a brief reflection, a risk‑to‑reward line.
Intermediate traders can add columns for indicator confirmation or market context to sharpen strategy.
Advanced traders might even link the journal to a cloud database to run automated trend checks, but the core principle stays the same: consistency beats perfection.
So, what’s your next step? Pick a format you’ll actually use, start logging immediately, and set a weekly 10‑minute review window.
Over months, that habit transforms raw trades into a roadmap for disciplined growth.
Remember, the journal’s true value lies in the questions it raises, not the answers it gives.
Keep writing, keep questioning, keep improving—your trading story is waiting.
If you find a pattern you like, test it on a demo account before committing real capital; the journal helps you verify that the pattern holds under pressure.
Finally, treat your journal as a living document: update columns as your strategy evolves, but never let it become a burden you avoid.
[…] not magic – it’s the power of systematic review. For a hands‑on example, check out our Forex Trading Journal Template: A Step‑by‑Step Blueprint for Accurate Record Keeping, which walks you through every field you should […]