Trend lines are the backbone of many forex charts. If you draw them wrong, you’ll see a lot of false signals and lose money. This guide shows you, step by step, how to use trend lines in forex analysis the right way. You’ll get usable tips, real‑world examples, and a checklist you can follow on any pair.
Step 1: Identify the Overall Trend Direction
The first thing you need to know is whether the market is moving up, down, or sideways. Look at a higher‑timeframe chart , daily or weekly , to get the big picture. If the price is making higher highs and higher lows, you have an uptrend. If it’s making lower highs and lower lows, that’s a downtrend. When the price bounces between roughly equal highs and lows, the market is range‑bound.
Why start with the big picture? Because a trend line drawn on a choppy market will be unreliable. In a strong uptrend, the line will act as support; in a downtrend, it will act as resistance.
Usable tip: Switch between at least two timeframes. If the daily chart shows an uptrend, but the four‑hour chart looks flat, give more weight to the daily view.
When you spot the direction, note the swing points that define it. These are the peaks (for a downtrend) or troughs (for an uptrend) you’ll later connect.
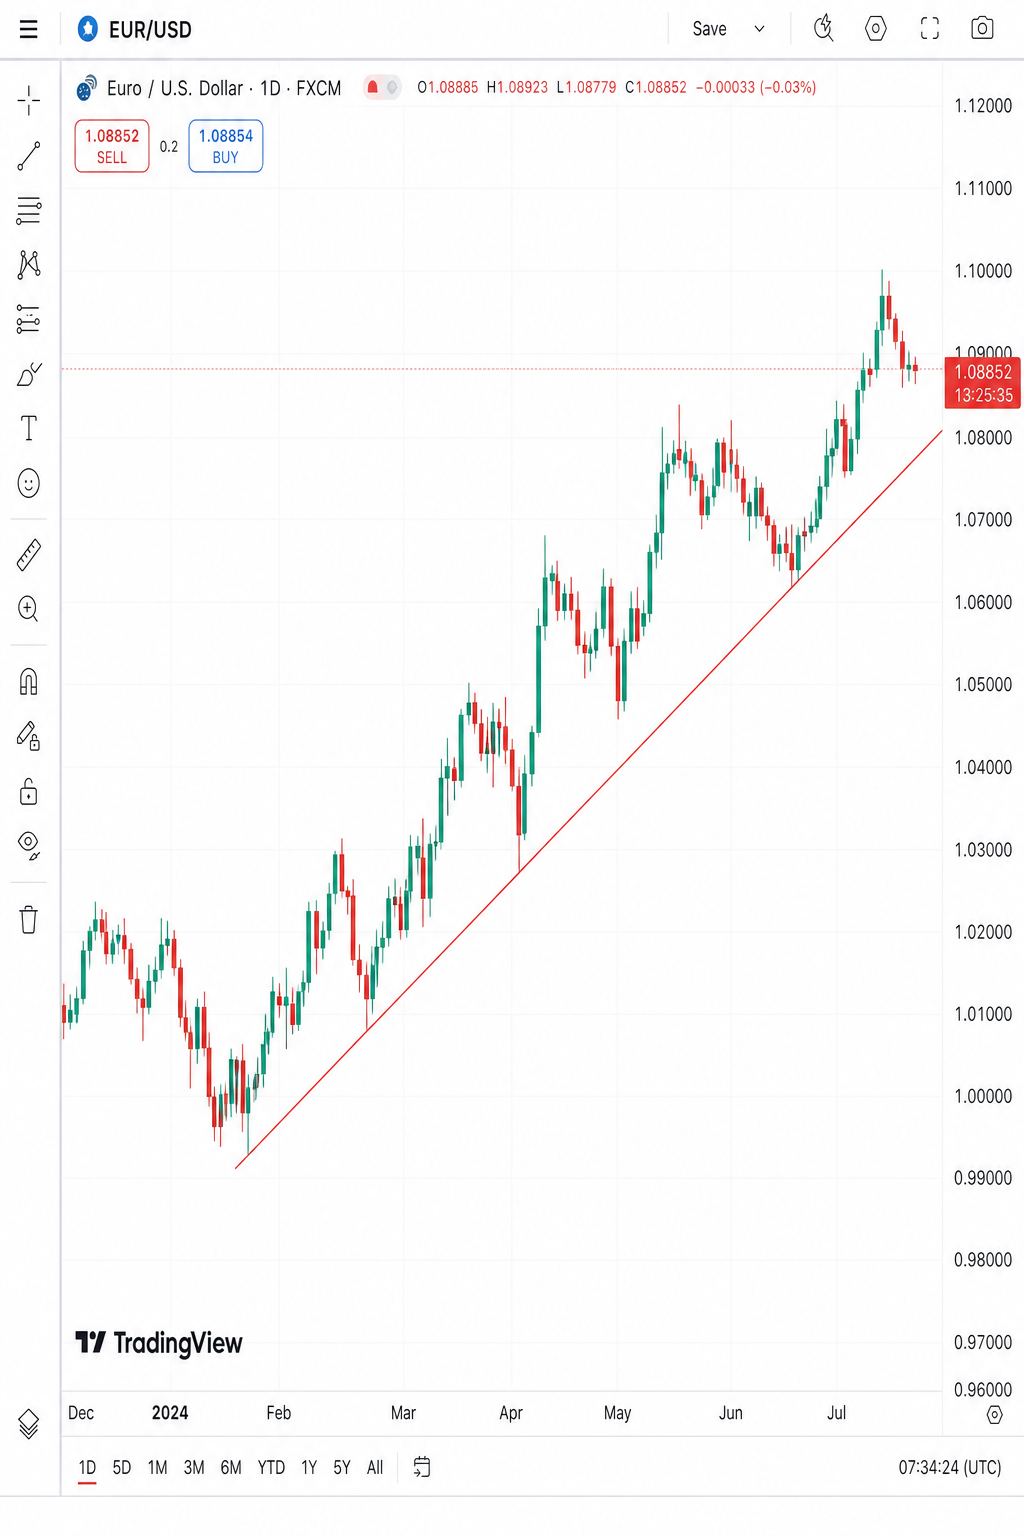
Imagine you are looking at EUR/USD on the daily chart. The price has risen from 1.0800 to 1.1200 over the last two weeks, making higher lows at 1.0900, 1.1000, and 1.1100. That pattern tells you the market is in an uptrend. You’re ready to move on to drawing the line.

Step 2: Draw the Trend Line Properly
Now you’ll connect the swing points you identified. Start with the first low (or high) and draw a straight line to the second. That creates the basic line. The third point is the real test , it tells you if the line holds.
According to Wikipedia’s definition of a trend line, a valid line should touch at least three swing points without cutting through candle bodies. The third touch confirms the line’s reliability.
Here’s how to do it:
- Pick two clear swing lows in an uptrend. Click the “trend line” tool on your platform.
- Snap the line to the low of the first candle (the body or wick, whichever you prefer).
- Drag the line to the second low. Make sure the line stays below the candle bodies.
- Look for a third low that touches or nearly touches the line. If it does, keep the line; if not, adjust the angle slightly.
Why does the third touch matter? Because a line built on just two points can be a coincidence. With three points, you’re seeing the market respect that level.
Pro tip: Use the wicks for more conservative lines, but the bodies if you want a stricter test. Both methods are accepted.
For a downtrend, reverse the process: connect two swing highs, then wait for a third high to confirm.
Once you have a line that survives three touches, you can treat it as a support (uptrend) or resistance (downtrend) zone.
Step 3: Validate the Trend Line with Confluence
A single line is useful, but it becomes powerful when it meets other signals. This is called confluence.
Common confluence tools include:
- Moving averages that sit near the line.
- Fibonacci levels that line up with the trend line.
- Price‑action patterns like pin bars or engulfing candles at the line.
When at least two of these line up, the chance of a true bounce or break improves dramatically.
For example, the 50‑day moving average may sit right on your uptrend line. If a bullish pin bar forms at that spot, you have three reasons to trust the level.
Embedding the video below helps you see the process in action:
Another key check is the market’s reaction after a touch. A strong bounce often follows a rejection candle. A weak bounce may signal a false move.
The Federal Reserve explains that foreign‑exchange markets react sharply to clear technical levels, especially when backed by economic data. Federal Reserve guidance on forex notes that traders watch these zones closely.
When confluence is missing, treat the line as a weaker guide. You might still use it for stop placement, but avoid entering large positions.
Step 4: Use Trend Lines for Entry and Exit Planning
With a solid line and confluence in place, you can plan trades. The 3‑touch rule is a popular entry trigger: the third touch coincides with a reversal candle, you go long (or short).
Why use the line for stops? Because the line marks a level where the market has previously turned. If price breaks that level, your stop is likely hit quickly.
For exits, watch for the opposite confluence. If you’re long and the price reaches a resistance line above, consider taking profit or tightening the stop.
“A trend line that holds three touches and aligns with a reversal pattern is a high‑probability entry point,” says a seasoned FX educator.
Remember to size your position based on the distance between entry and stop. Larger distances need smaller lots to keep risk under control.
Step 5: Common Mistakes & How to Avoid Them
Even experienced traders slip up. Below are the most frequent errors and ways to fix them.
- Forcing the line.Drawing a line that fits a bias, rather than the market, creates an illusion. Always let the swing points dictate the angle.
- Using only two points.Two points can be a coincidence. Seek the third touch before trusting the line.
- Ignoring market structure.In a choppy range, trend lines lose value. Switch to range‑bound strategies instead.
- Missing the “takeoff” trap.A rapid move away from the line often precedes a reversal. Watch for a loss of momentum.
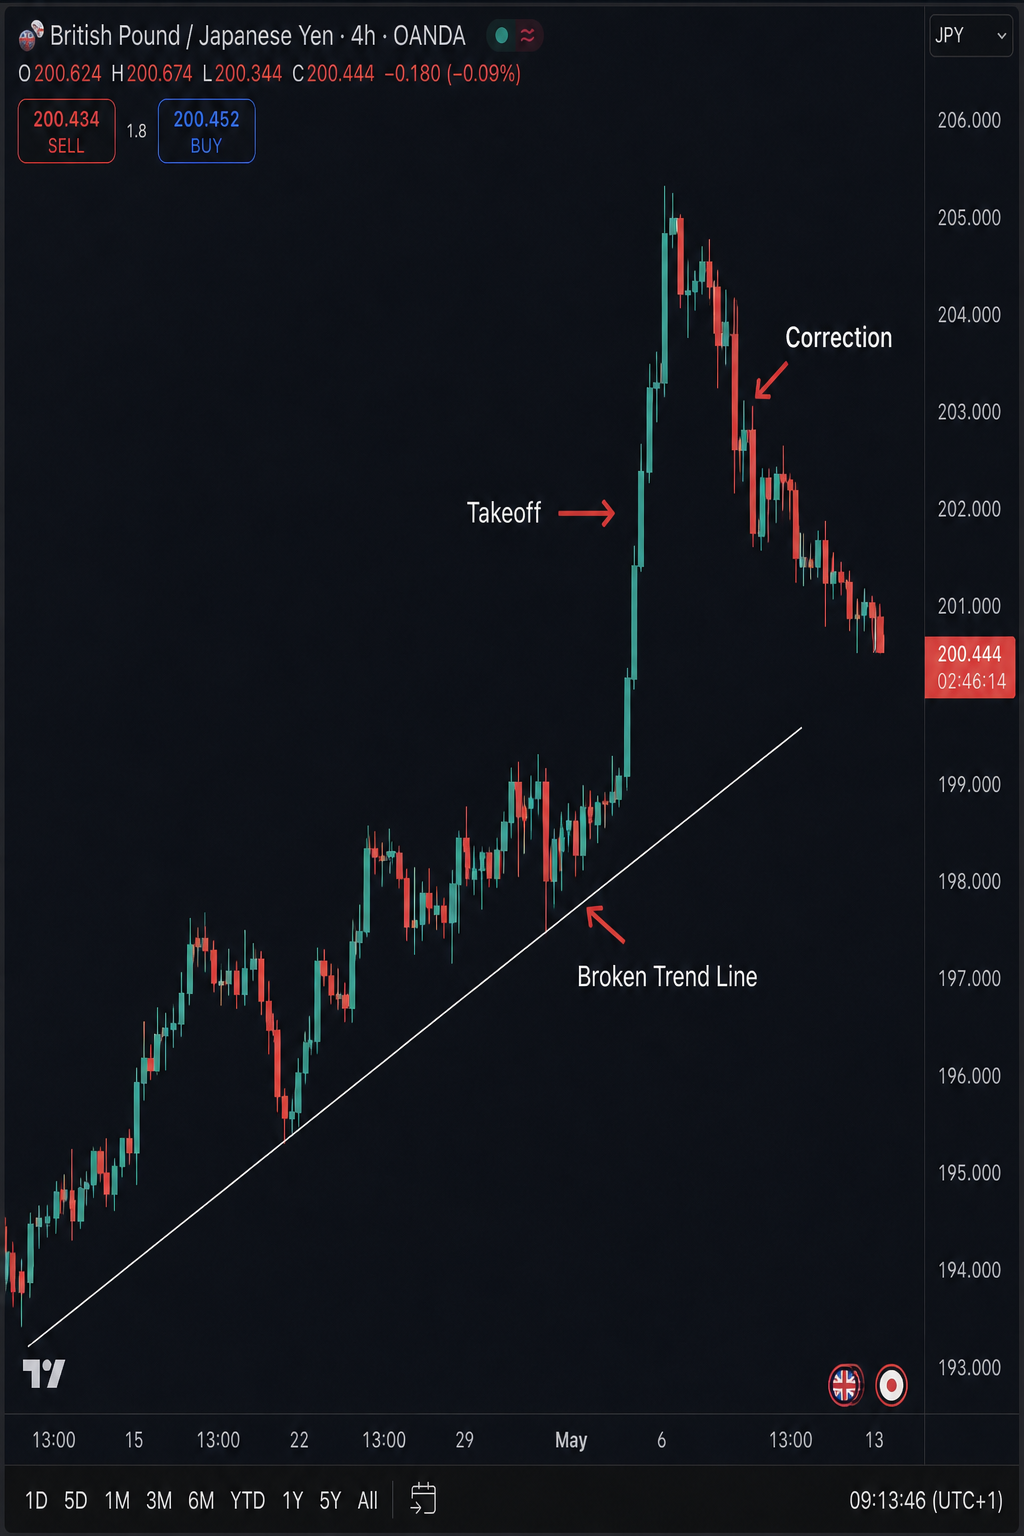
Imagine you’re looking at GBP/JPY on a one‑hour chart. You draw an uptrend line that looks good, but the market is actually in a tight range. The price spikes away from the line, then snaps back , a classic takeoff. If you had recognized the choppy structure, you would have stayed out.
Another pitfall is placing stops too tight. If you set a stop just a few pips above the line, normal noise can trigger it. Give the market a little breathing room , 1‑2 pips beyond the line is often enough.
FXDoctor.blog teaches these exact steps in its curriculum, helping novices avoid these traps before they trade live.
FAQ
What time frame is best for drawing trend lines?
Higher time frames give stronger signals. A daily or weekly chart shows the main market direction. You can still use a 4‑hour or 1‑hour chart for finer entries, but always confirm the trend on a higher frame first.
Do I draw trend lines on closing prices or wicks?
Both methods work. Using wicks creates a more forgiving line, while bodies give a stricter test. Many traders start with wicks for support lines and switch to bodies when they want higher confidence.
How many touches are enough?
Three touches are the industry standard. The first two define the line; the third confirms it. More touches increase confidence, but three is the minimum for reliable use.
Can I use trend lines on all currency pairs?
Yes, but liquidity matters. Major pairs like EUR/USD or USD/JPY often produce cleaner swings. Exotic pairs can be noisy, making trend lines less reliable.
What if the price breaks the trend line?
A break can signal a reversal or a continuation. Look for confluence: a break with high volume, a confirming pattern, or a related indicator moving in the same direction strengthens the signal.
How do I manage risk with trend‑line trades?
Set stops just beyond the line you’re using as support or resistance. Size your position so that the potential loss equals a small percentage of your account, typically 1‑2%.
Is there a way to automate trend‑line detection?
Some platforms offer auto‑draw tools, but they can misplace lines in choppy markets. Manual drawing lets you apply judgment and avoid forced lines.
Should I combine trend lines with other indicators?
Absolutely. Trend lines work best with momentum tools like RSI or MACD, and with price‑action patterns. The more the signals agree, the higher the probability of success.
Conclusion
Trend lines are simple, yet they pack a lot of power when used correctly. Start by spotting the big‑picture trend, then draw a line that touches three clear swing points. Validate the line with confluence , moving averages, Fibonacci, or reversal candles , before you risk capital. Use the line for entry, stop, and target placement, and stay alert for common traps like forced lines or takeoff moves.
Practice each step on a demo account. Follow the checklist we’ve built, and you’ll see fewer false signals and tighter risk control. When you feel ready, the Forex Trend Lines Tutorial: A Step‑by‑Step Guide for Beginners on FX Doctor can walk you through real‑time examples and help you turn these concepts into habit.
Keep the process disciplined. Consistency, three‑point confirmation, and solid confluence are the trio that turns a basic line into a reliable trading tool.